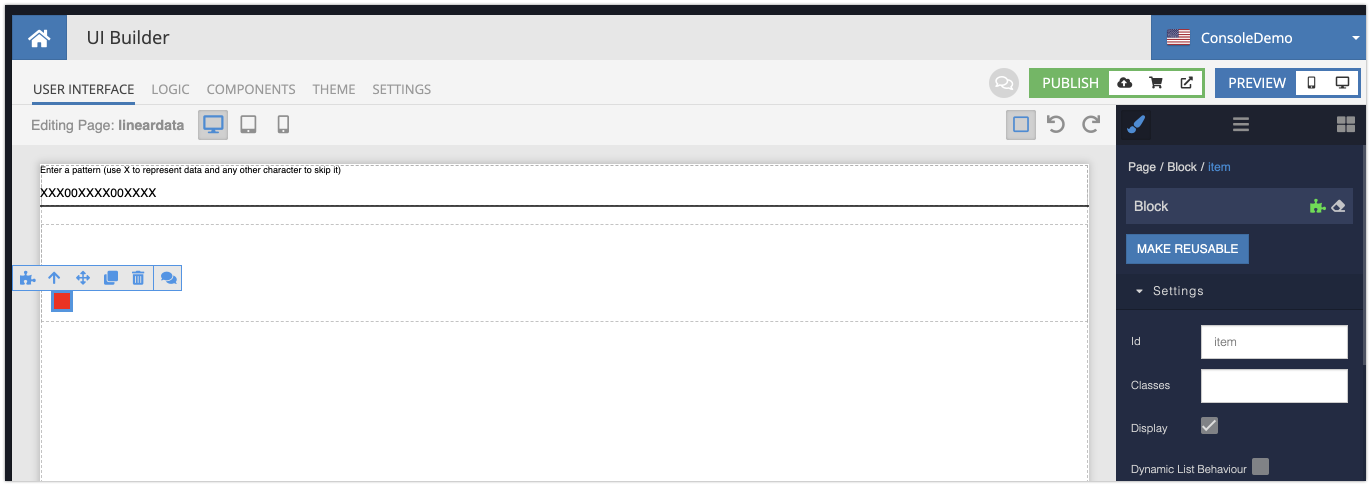
Hi, I’m currently displaying data over time in a linear way to help the end-user make business decisions.
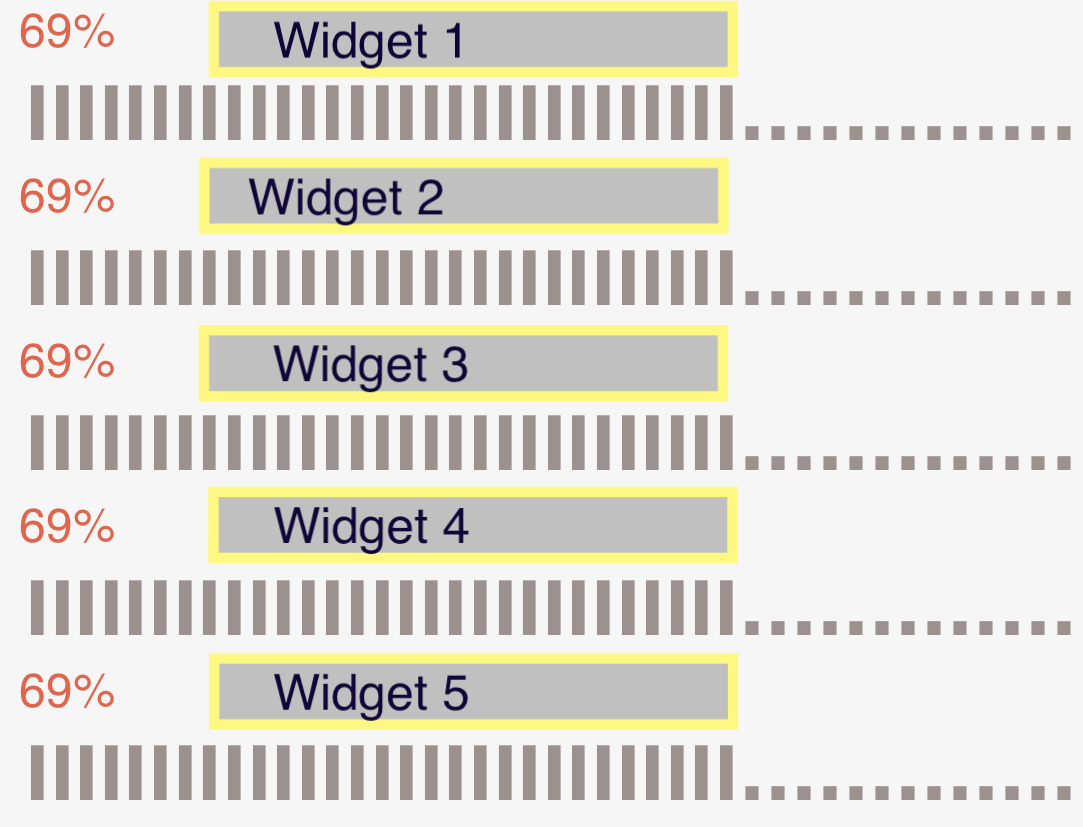
Initially I started with ‘xxxxx_____xxxxxx____’ to show when items might be available over the required time. I’ve refined this to ‘llllllll…lllllllllll…’ [using Roboto font], which offers a better visual.
Would anyone know of any code snippets to depict data over time / linear?
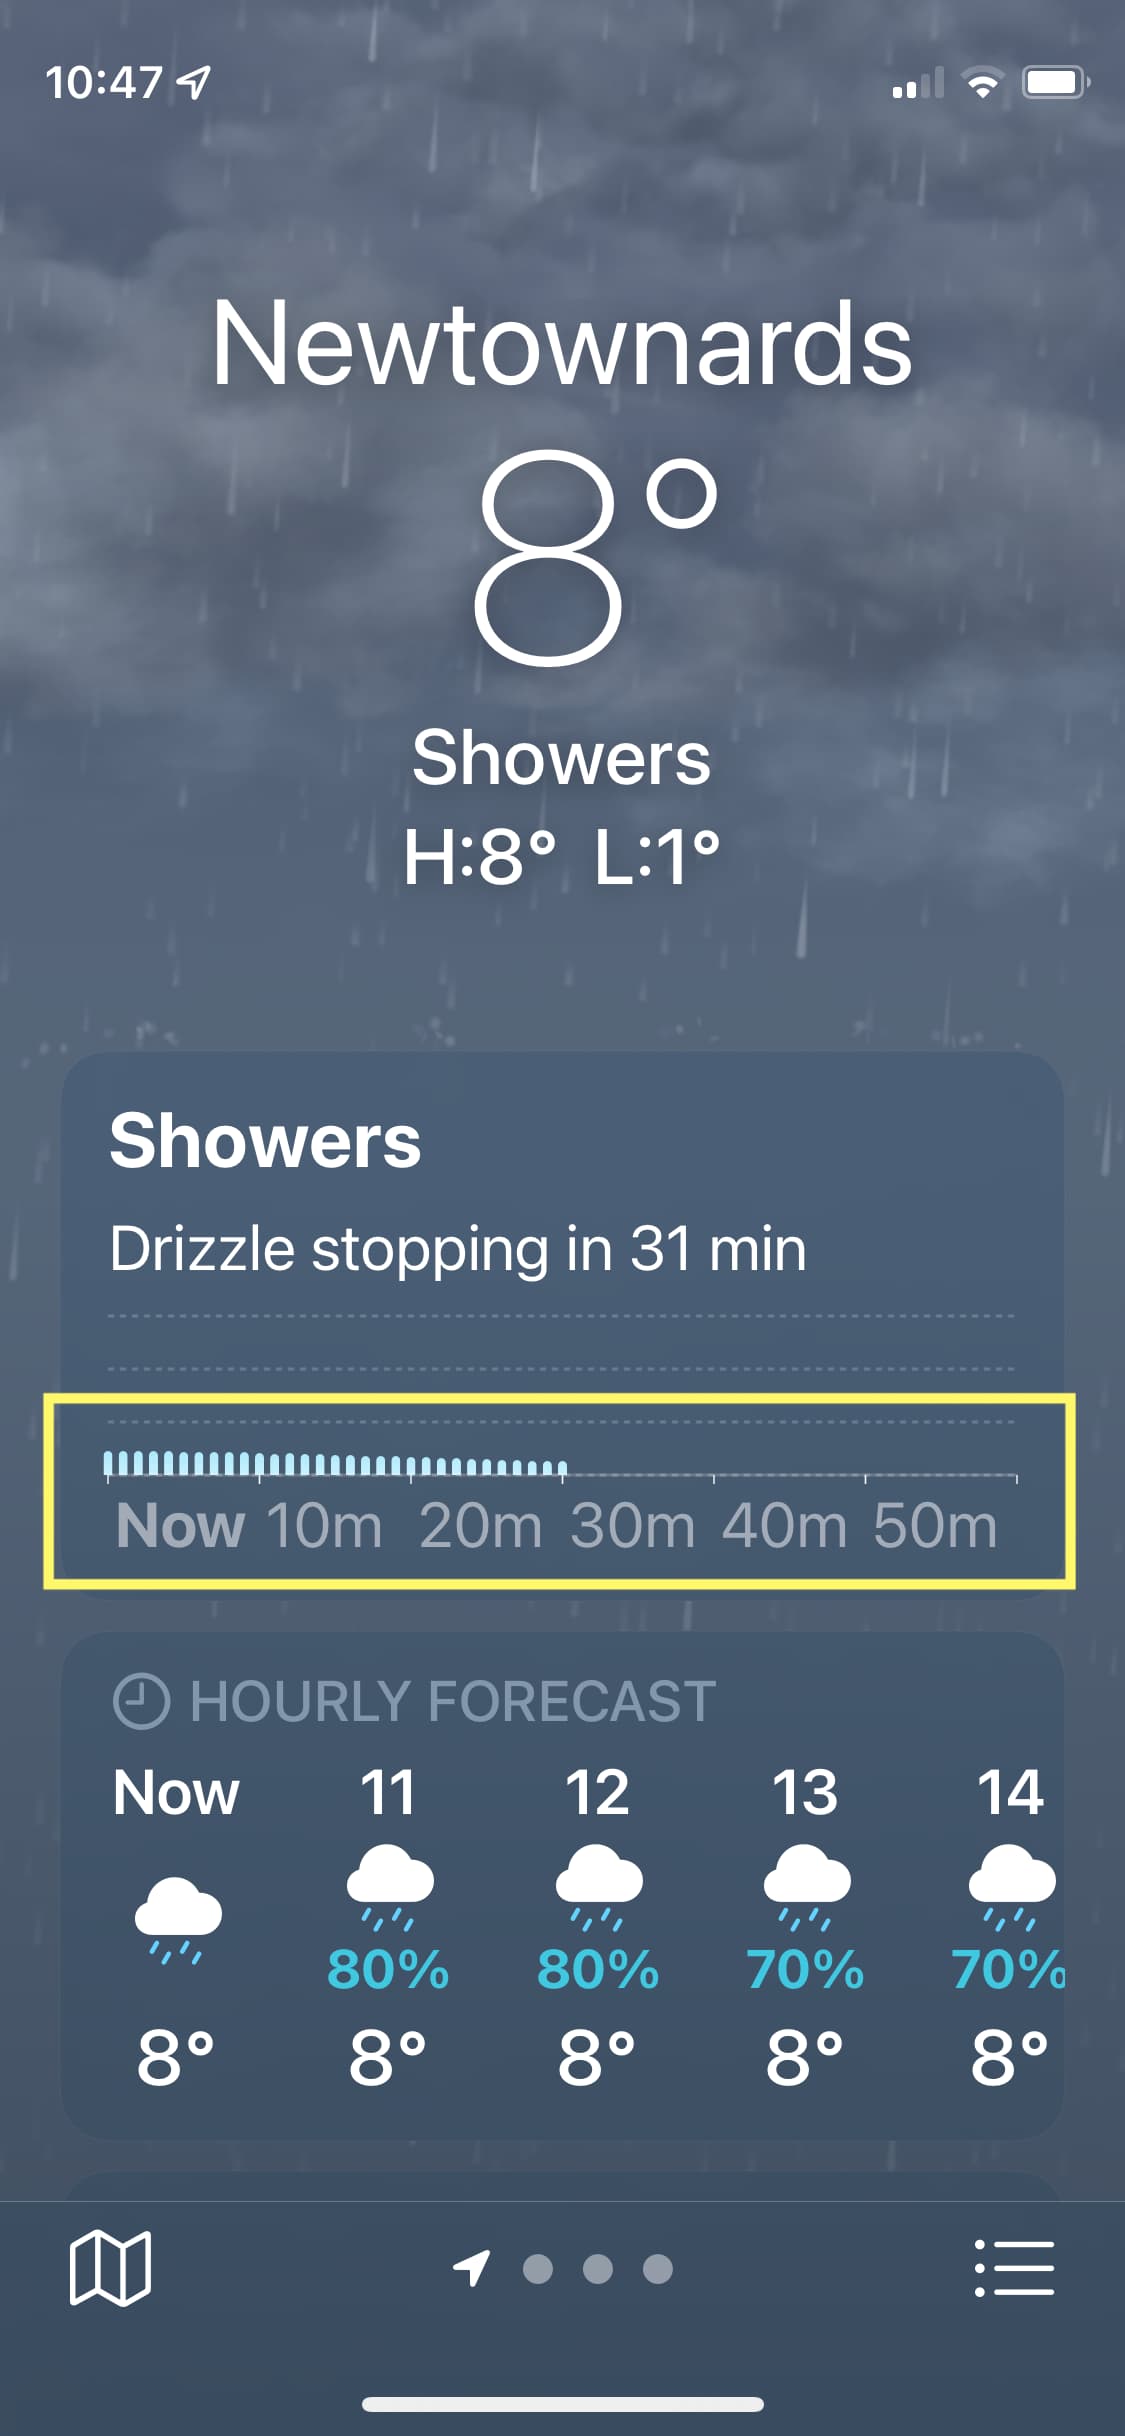
I’m using the idea to show when items may be available, but other cases would be ‘battery load over time’, ‘weather forecast’ etc.
My requirements are for a simple mono display showing true or false on a 50 step/point line.
Hi @Paul_HIllen,
actually, I don’t quite understand what you need. Could you please show some examples of what you want to achieve?
Stanislaw
Hi Paul,
It would be helpful if you could attach a drawing of what you’d like the page to look like. A hand drawing would do as well.
Regards,
Mark

Thanks for the clarification.
The UI Builder supports custom components, custom javascript code and custom CSS styles, so this task can be solved, but we do not have a ready-made component out of the box for this. I think this is not a rare task in the frontend world, and I recommend you look for solutions on sites such as stackoverflow or codepen.
Regards,
Stanislaw
Hi Paul,
Does this do what you’re looking for?
https://www.backendless.us/api/files/ui-builder/containers/support/index.html?page=lineardata
Regards,
Mark
Hi Mark, That’s the idea. Are your elements ascii characters or (…hold my breath…) graphics?