Hello @Krisztian_Pinter
With Backendless you can do it very easy!
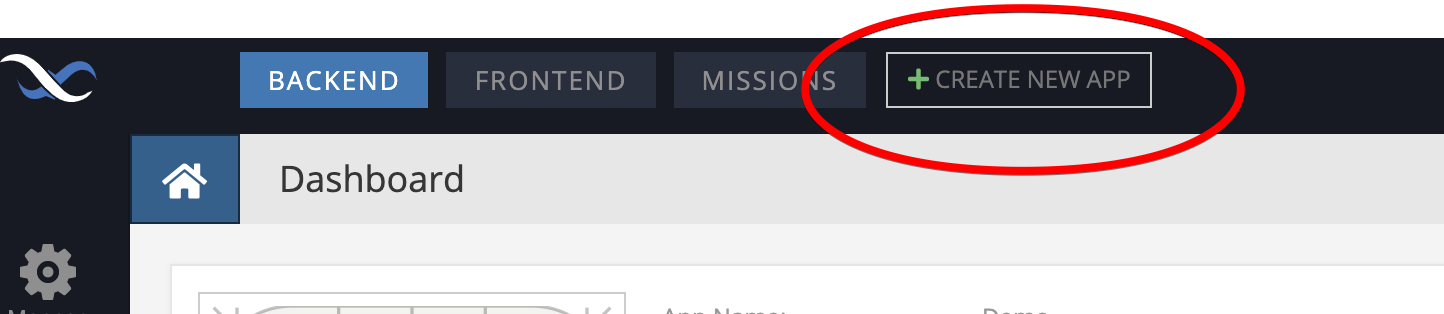
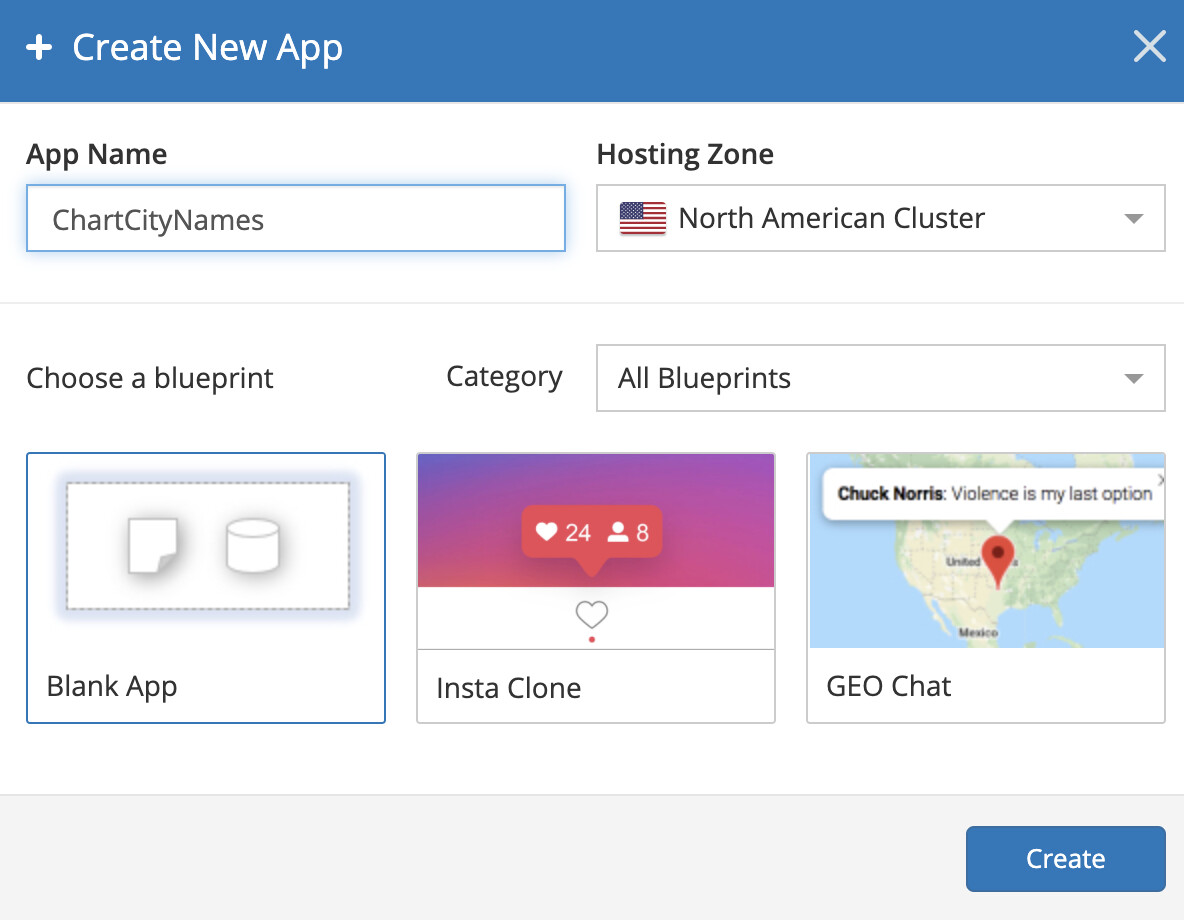
- Create new app
Choose name
2.Creat simple table
- Create a chart
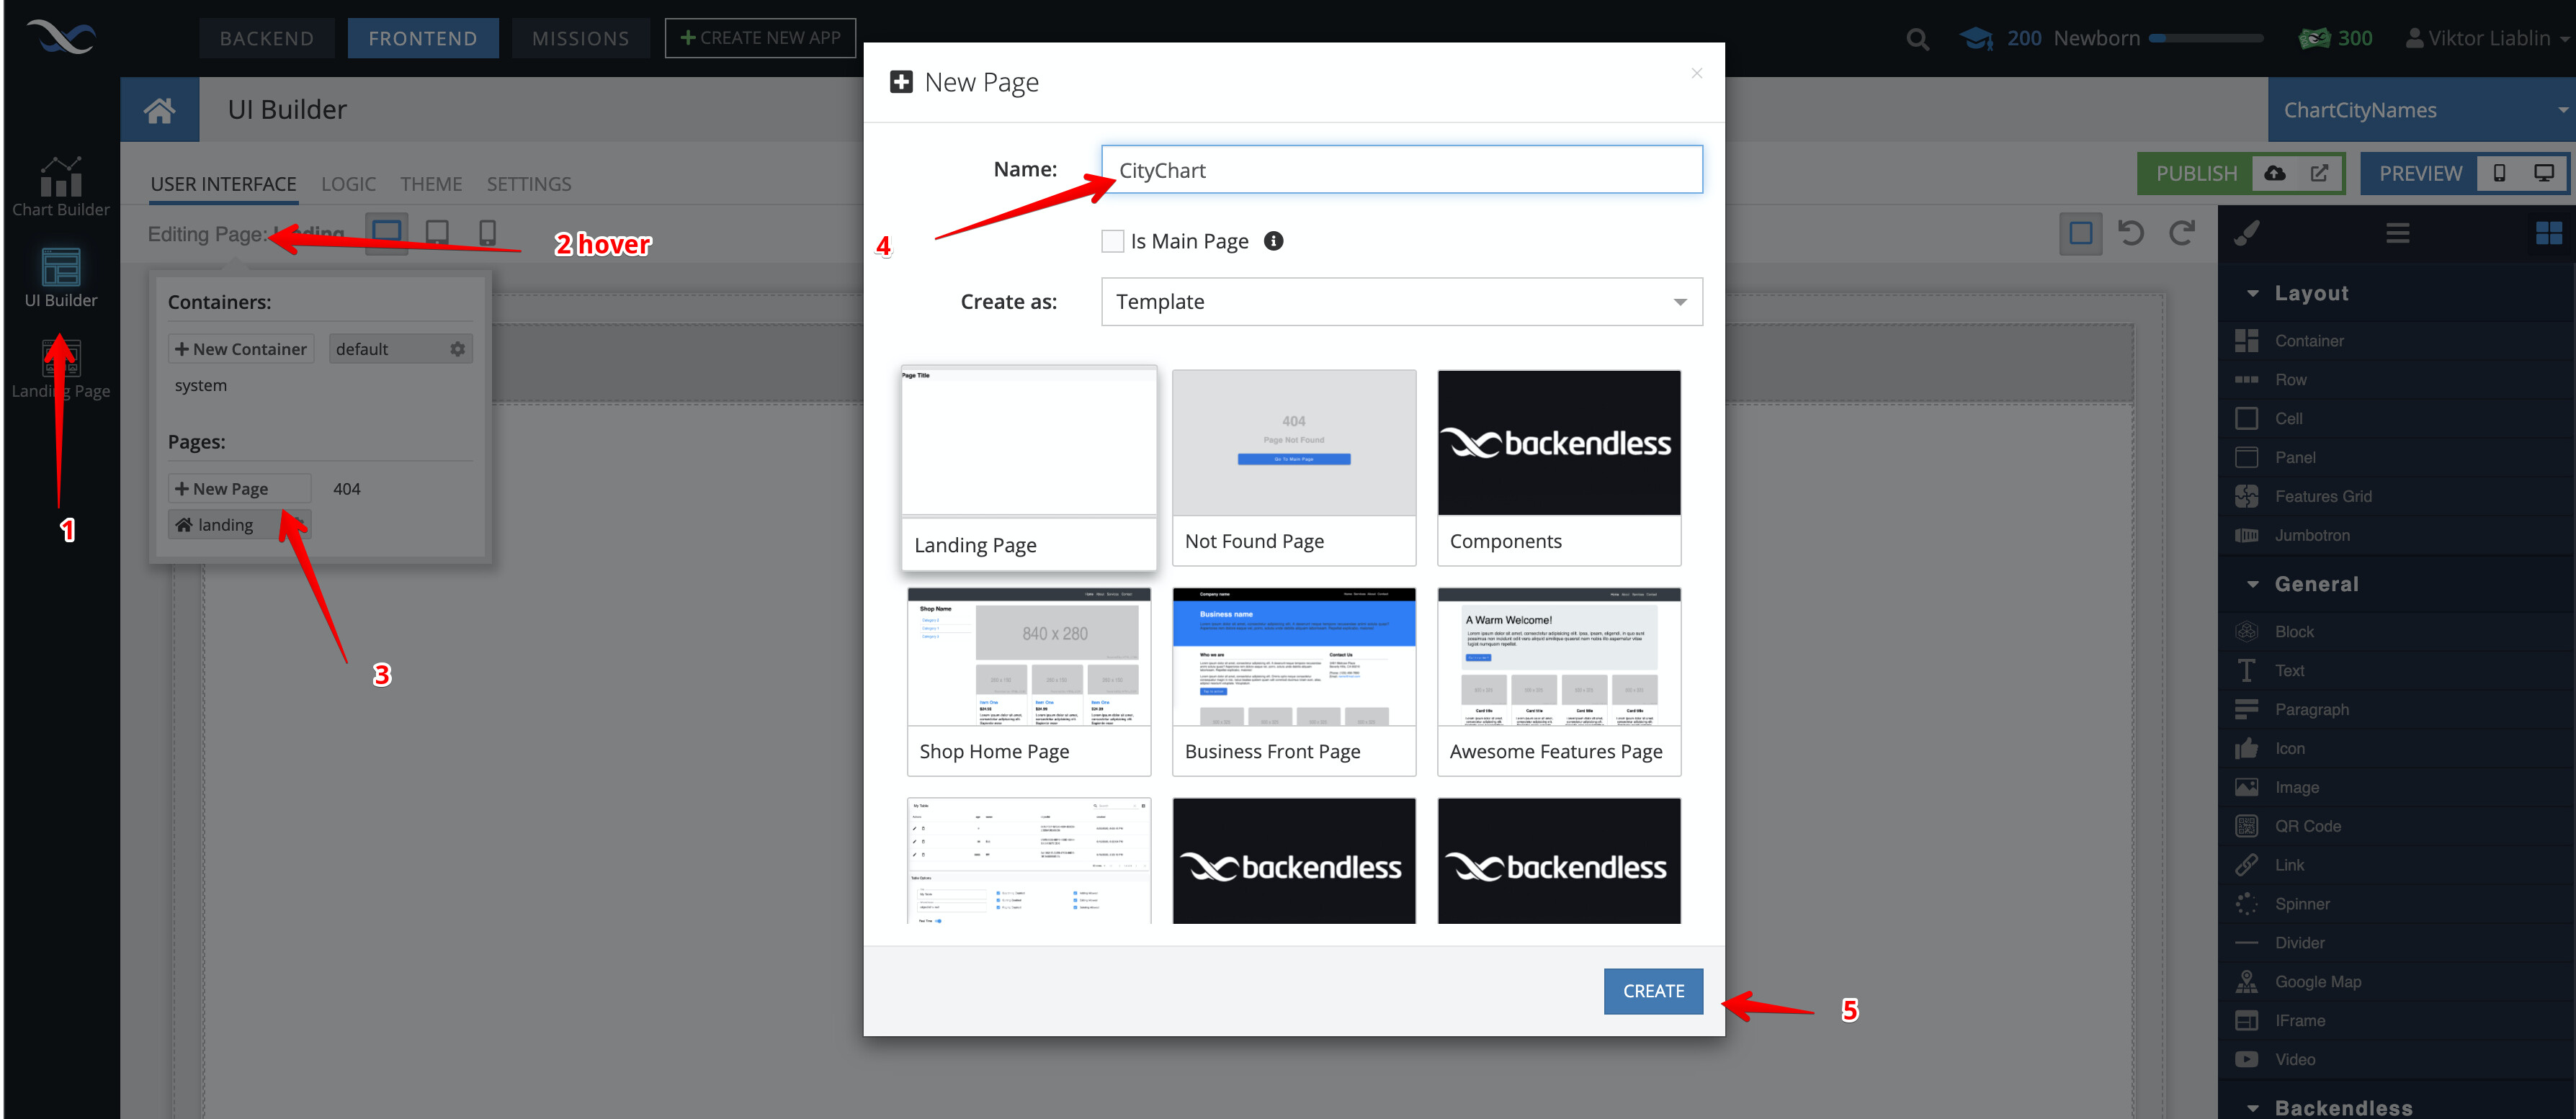
- Create page in UI-builder
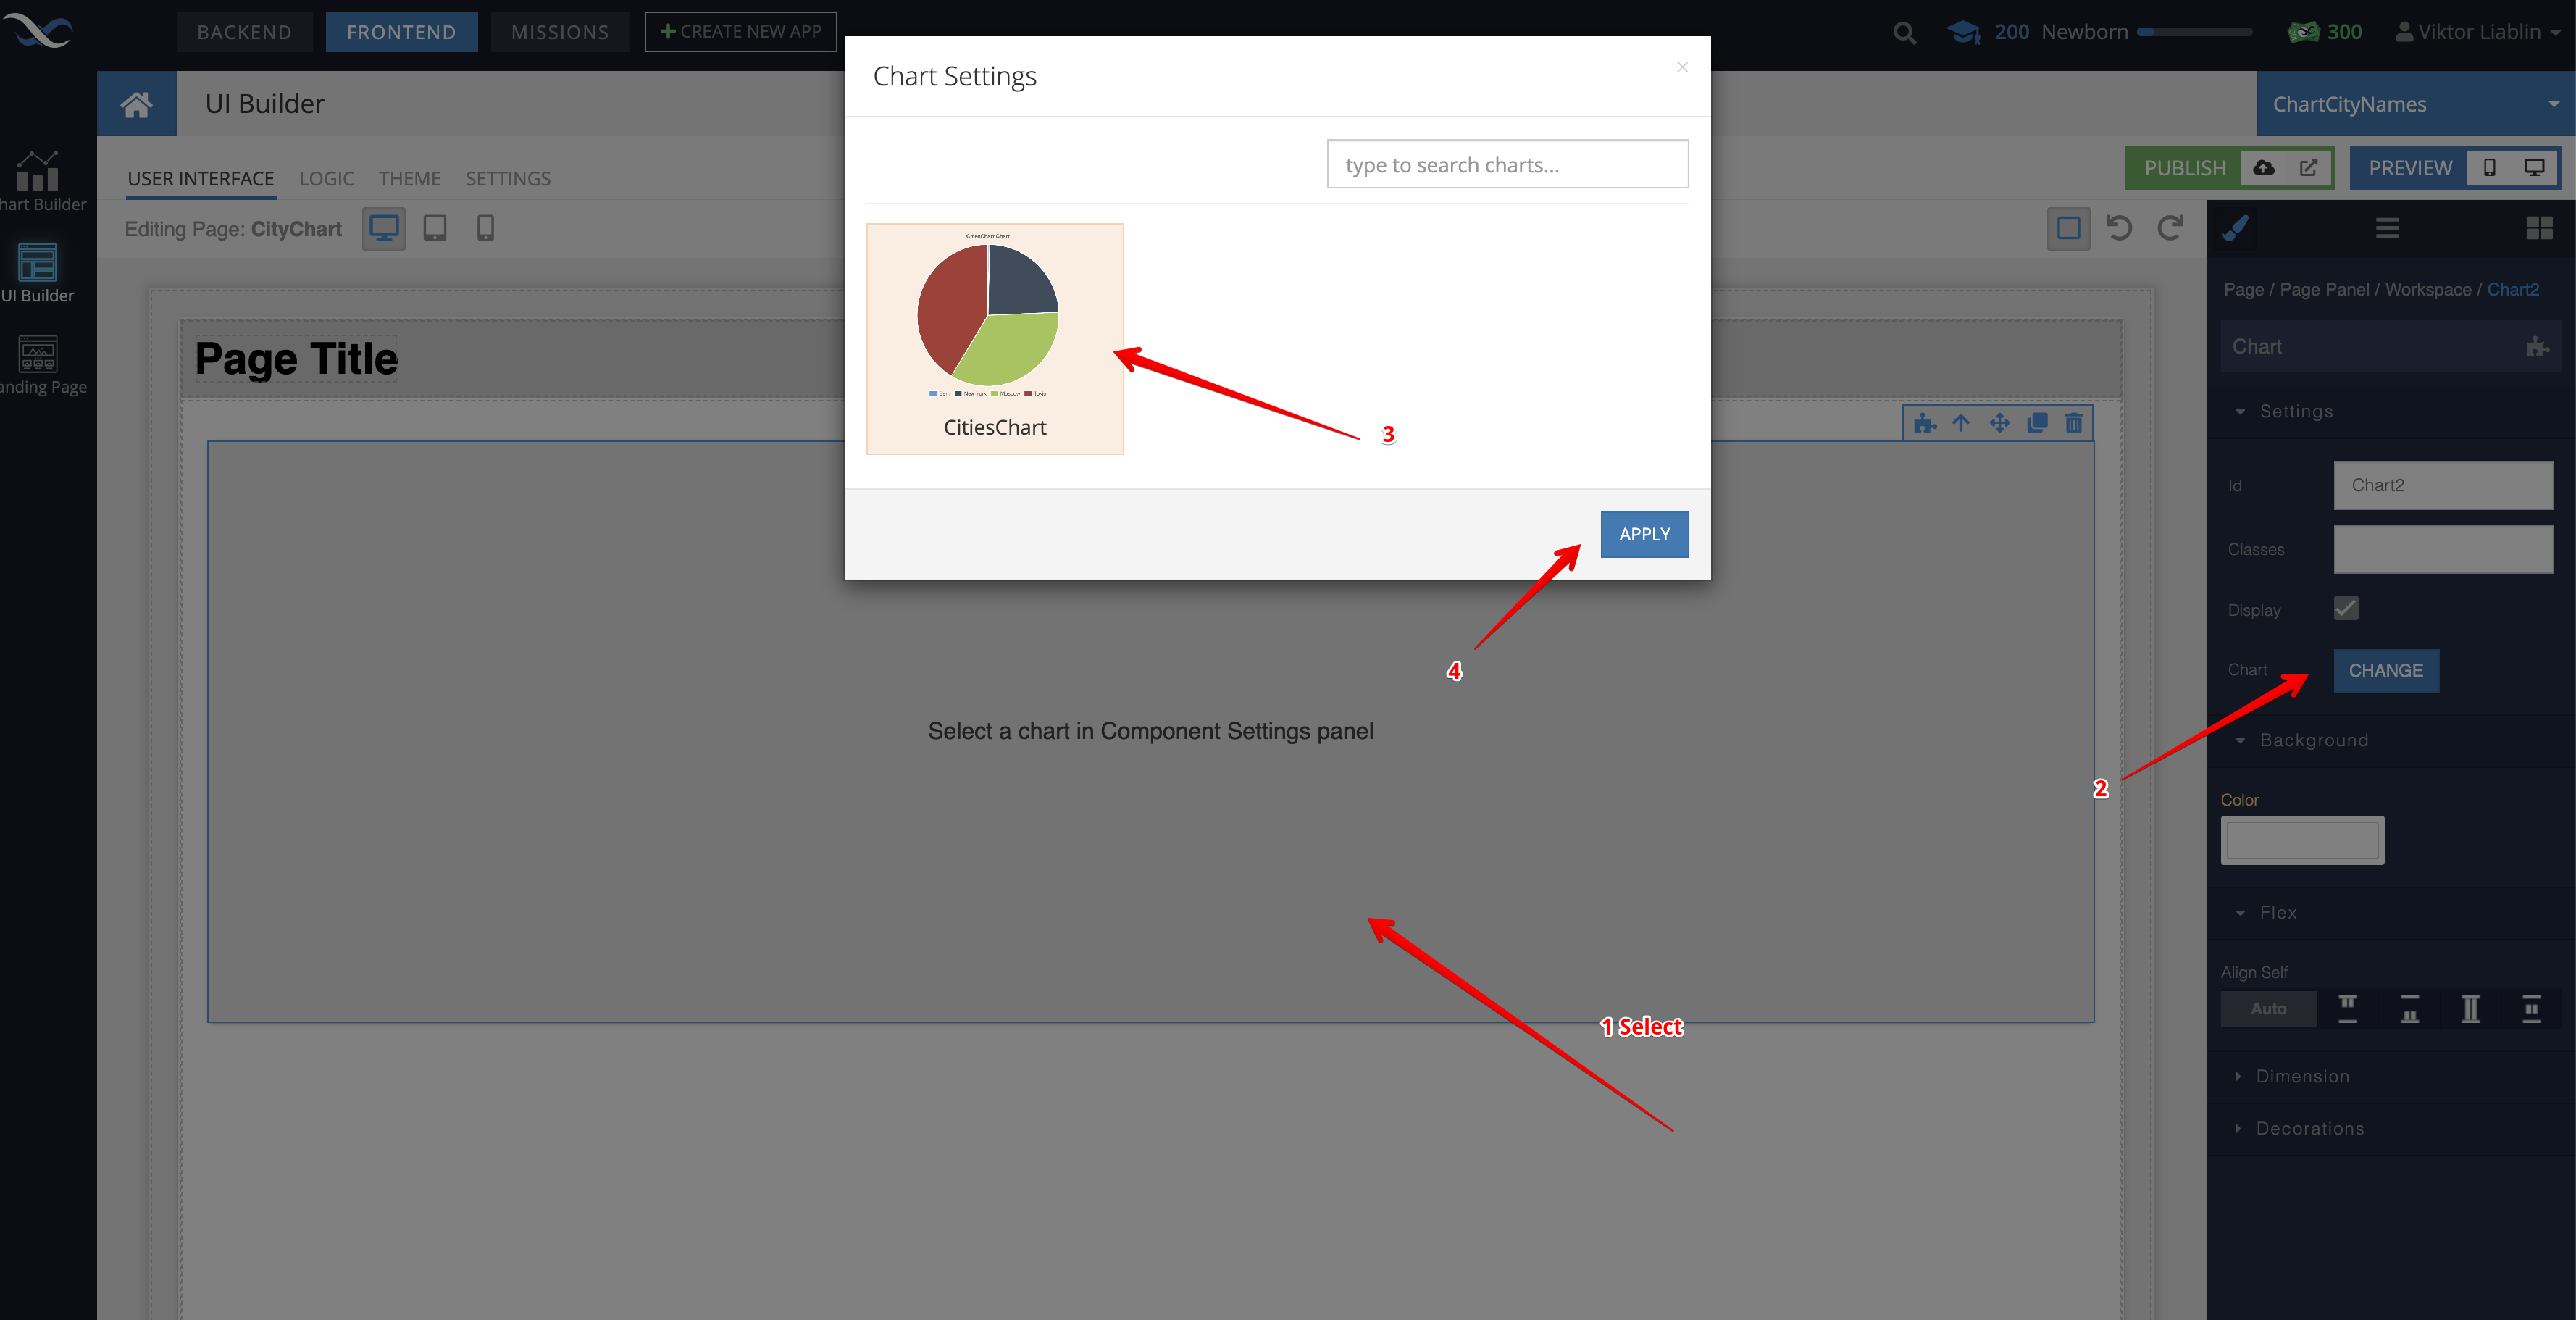
- Choose Chart from files
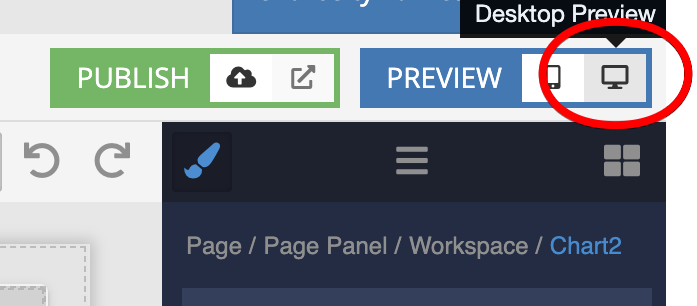
- Go to preview
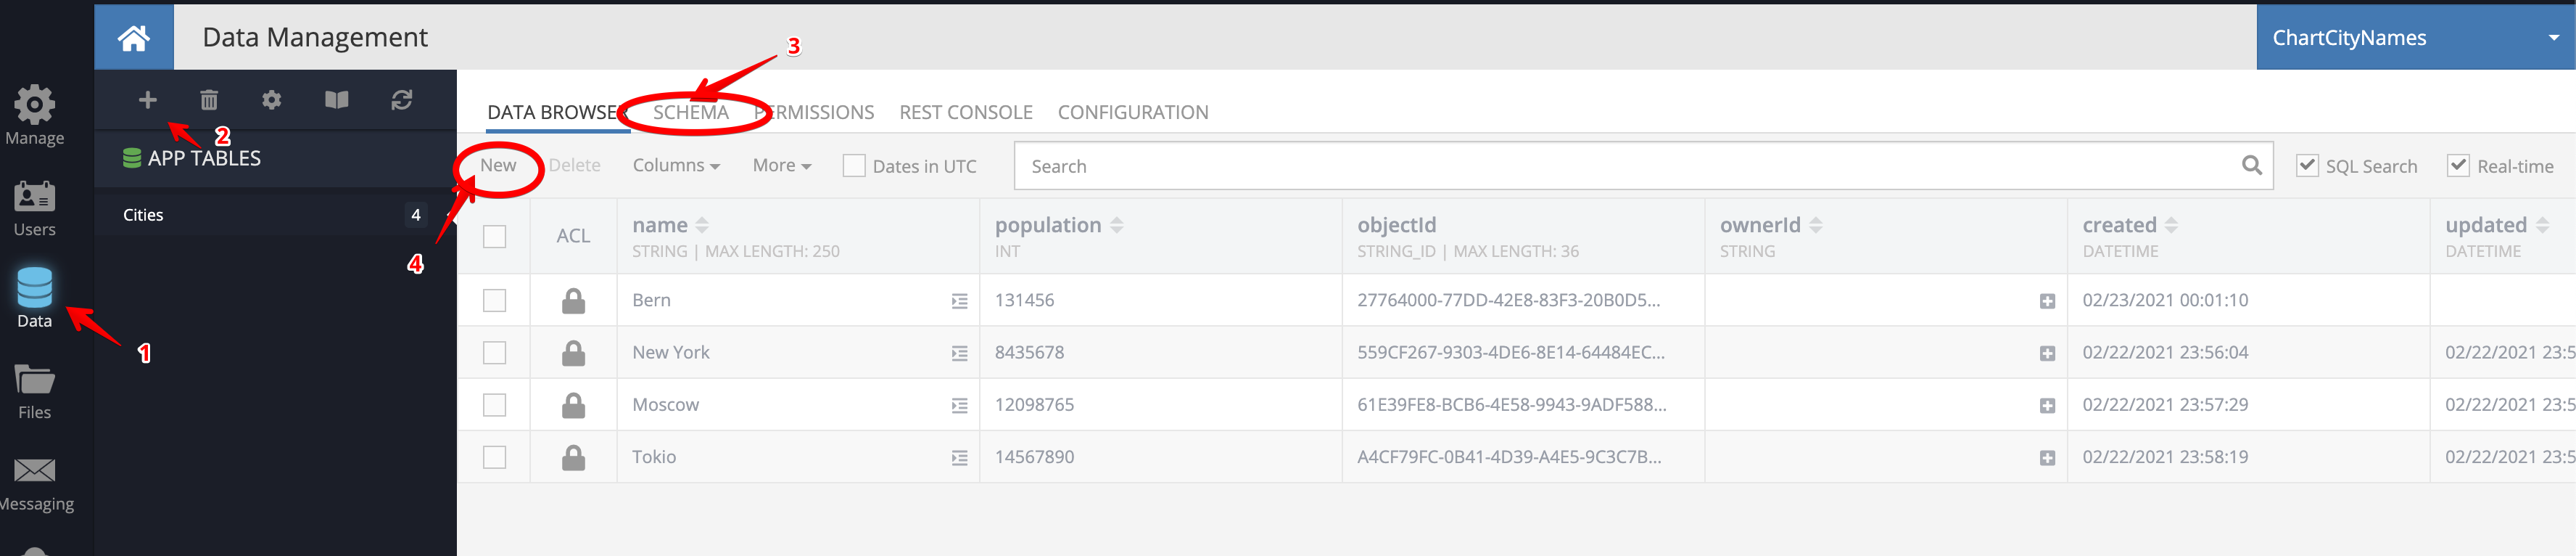

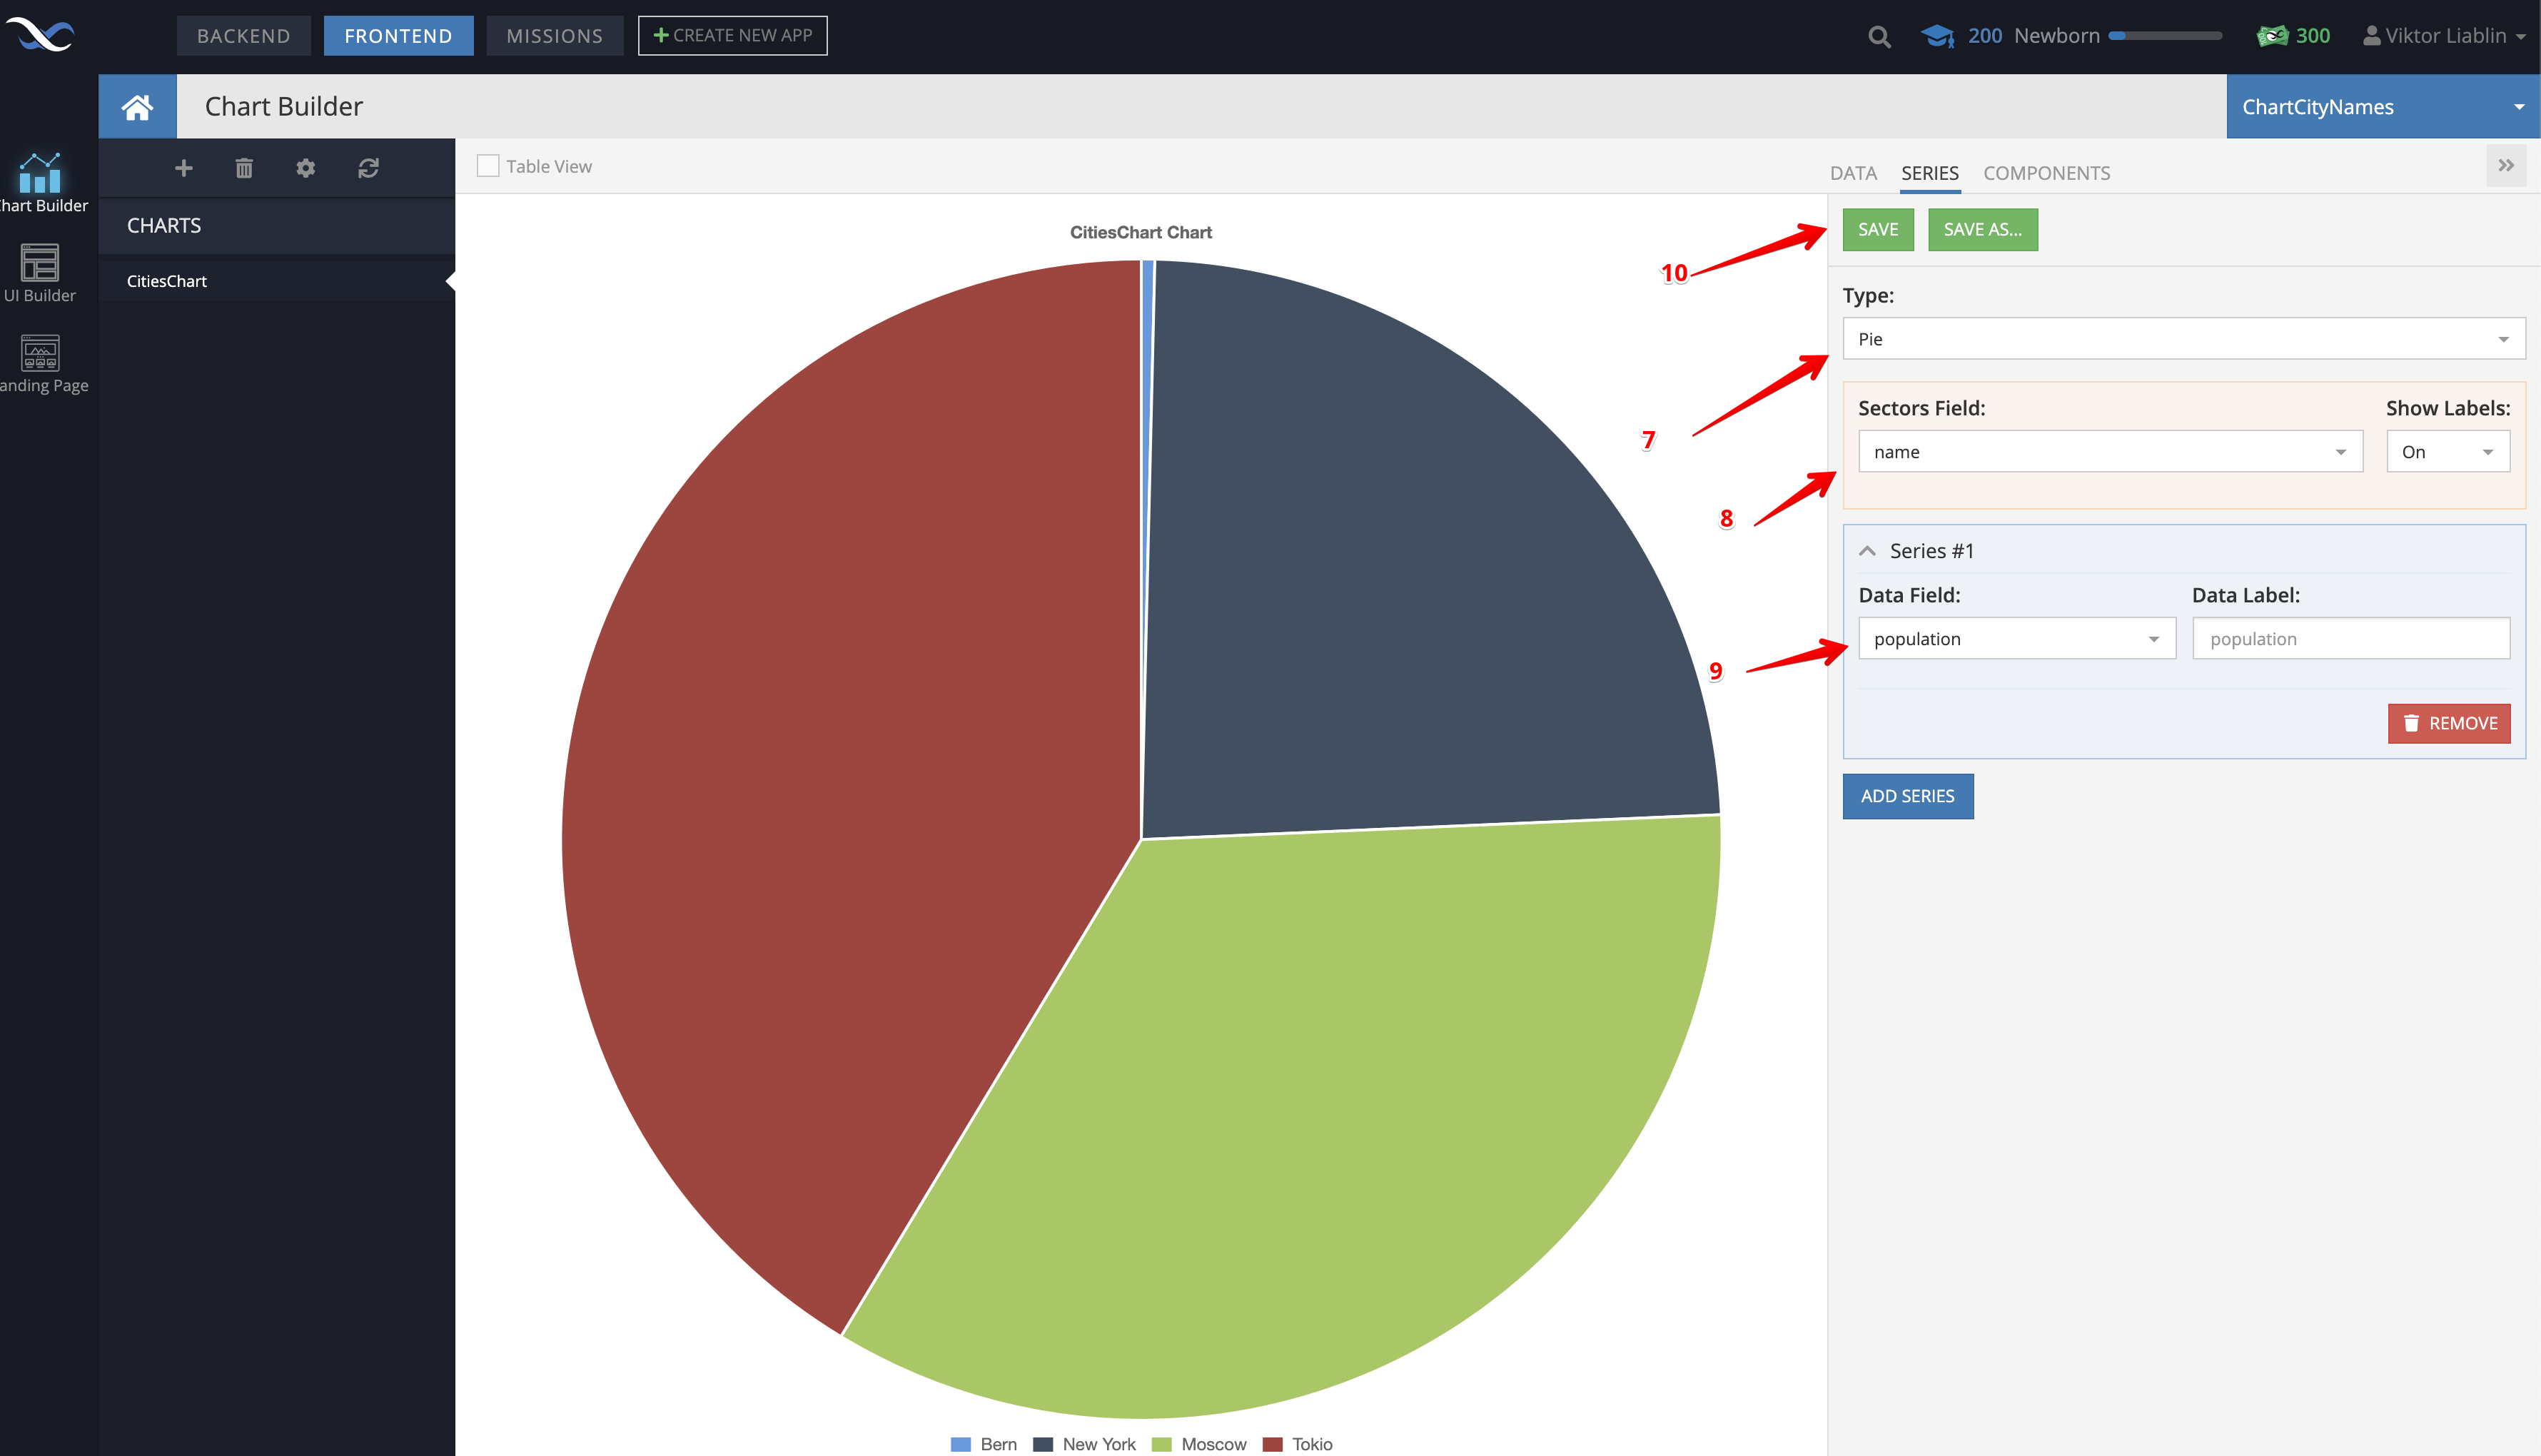

In new tab you can change values of population in table Cities and see changes in live
This was a simple example. You can customize this very much
Regard, Viktor