How to use Chrome Dev Tools as is shown in the tutorial videos?

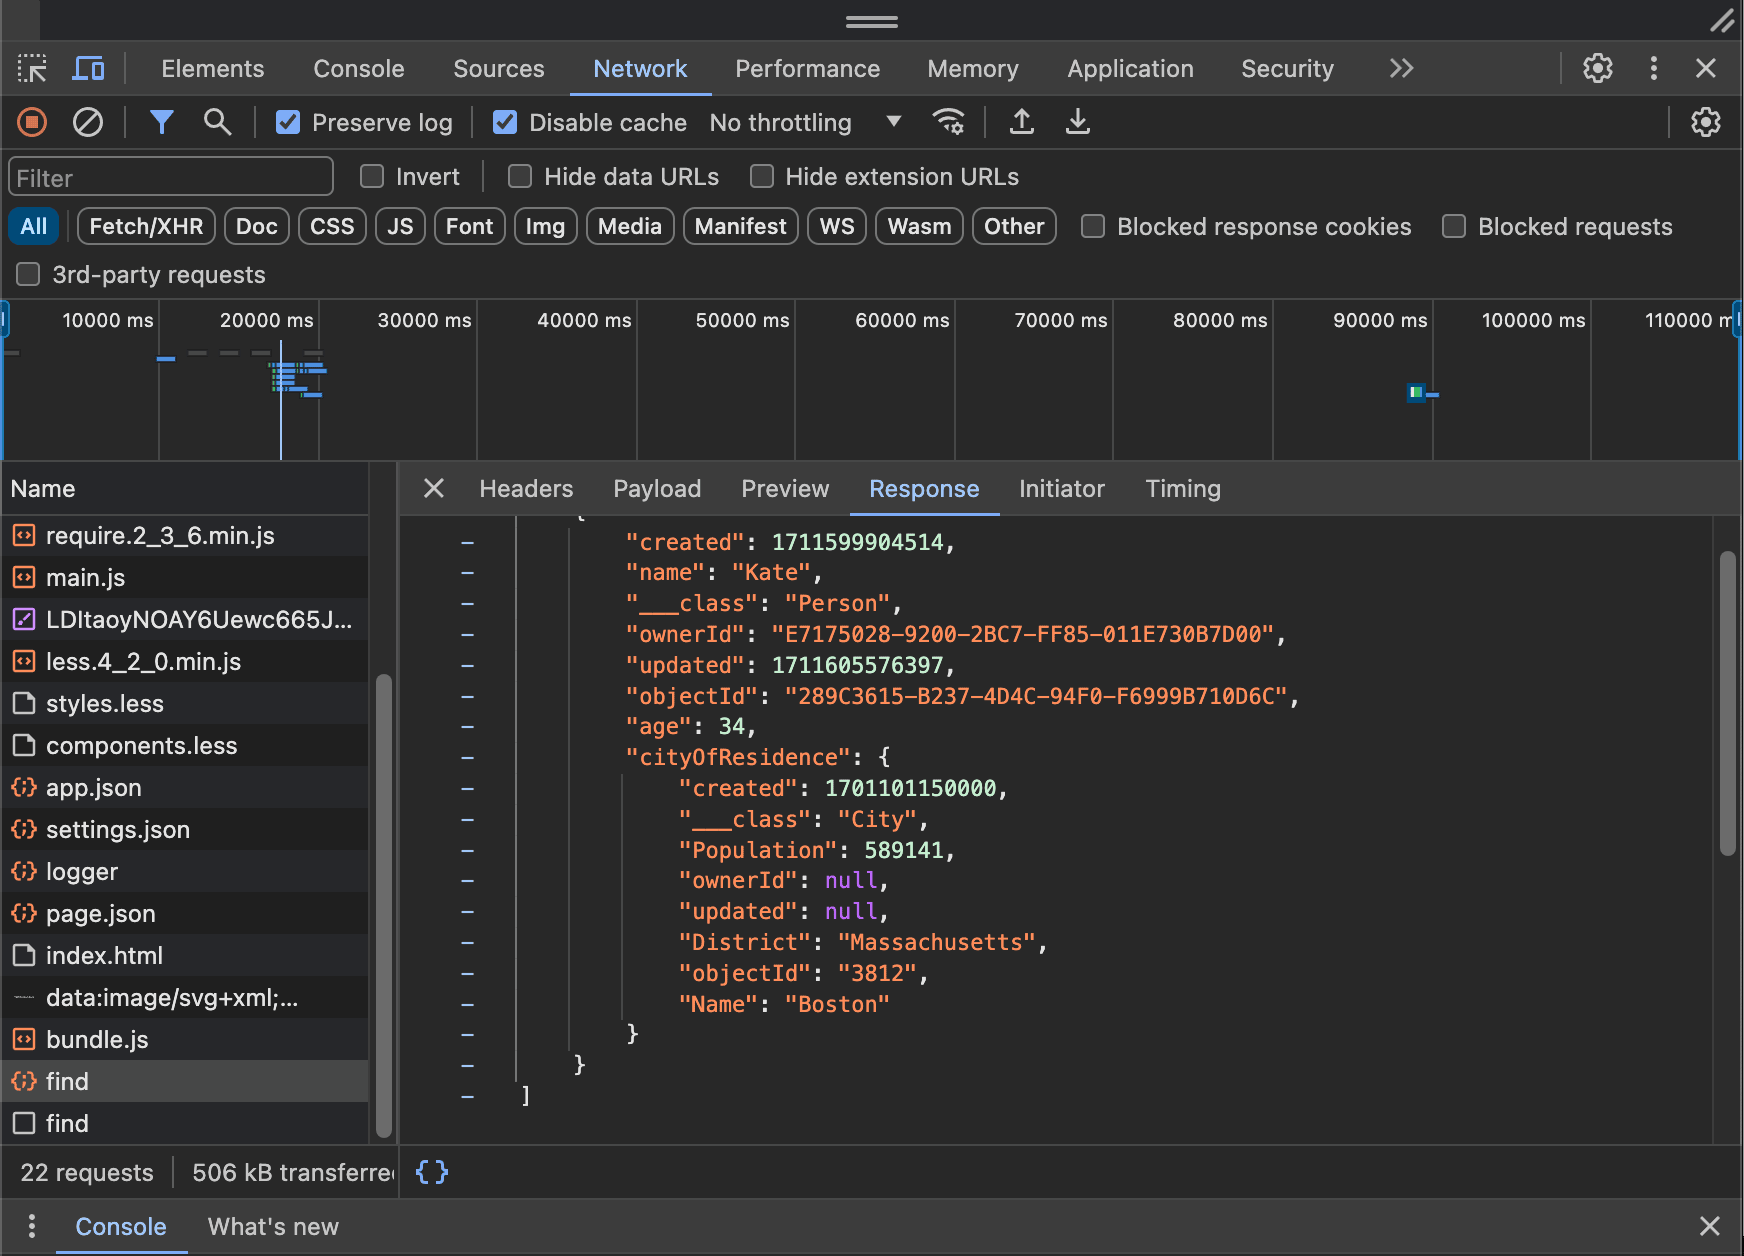
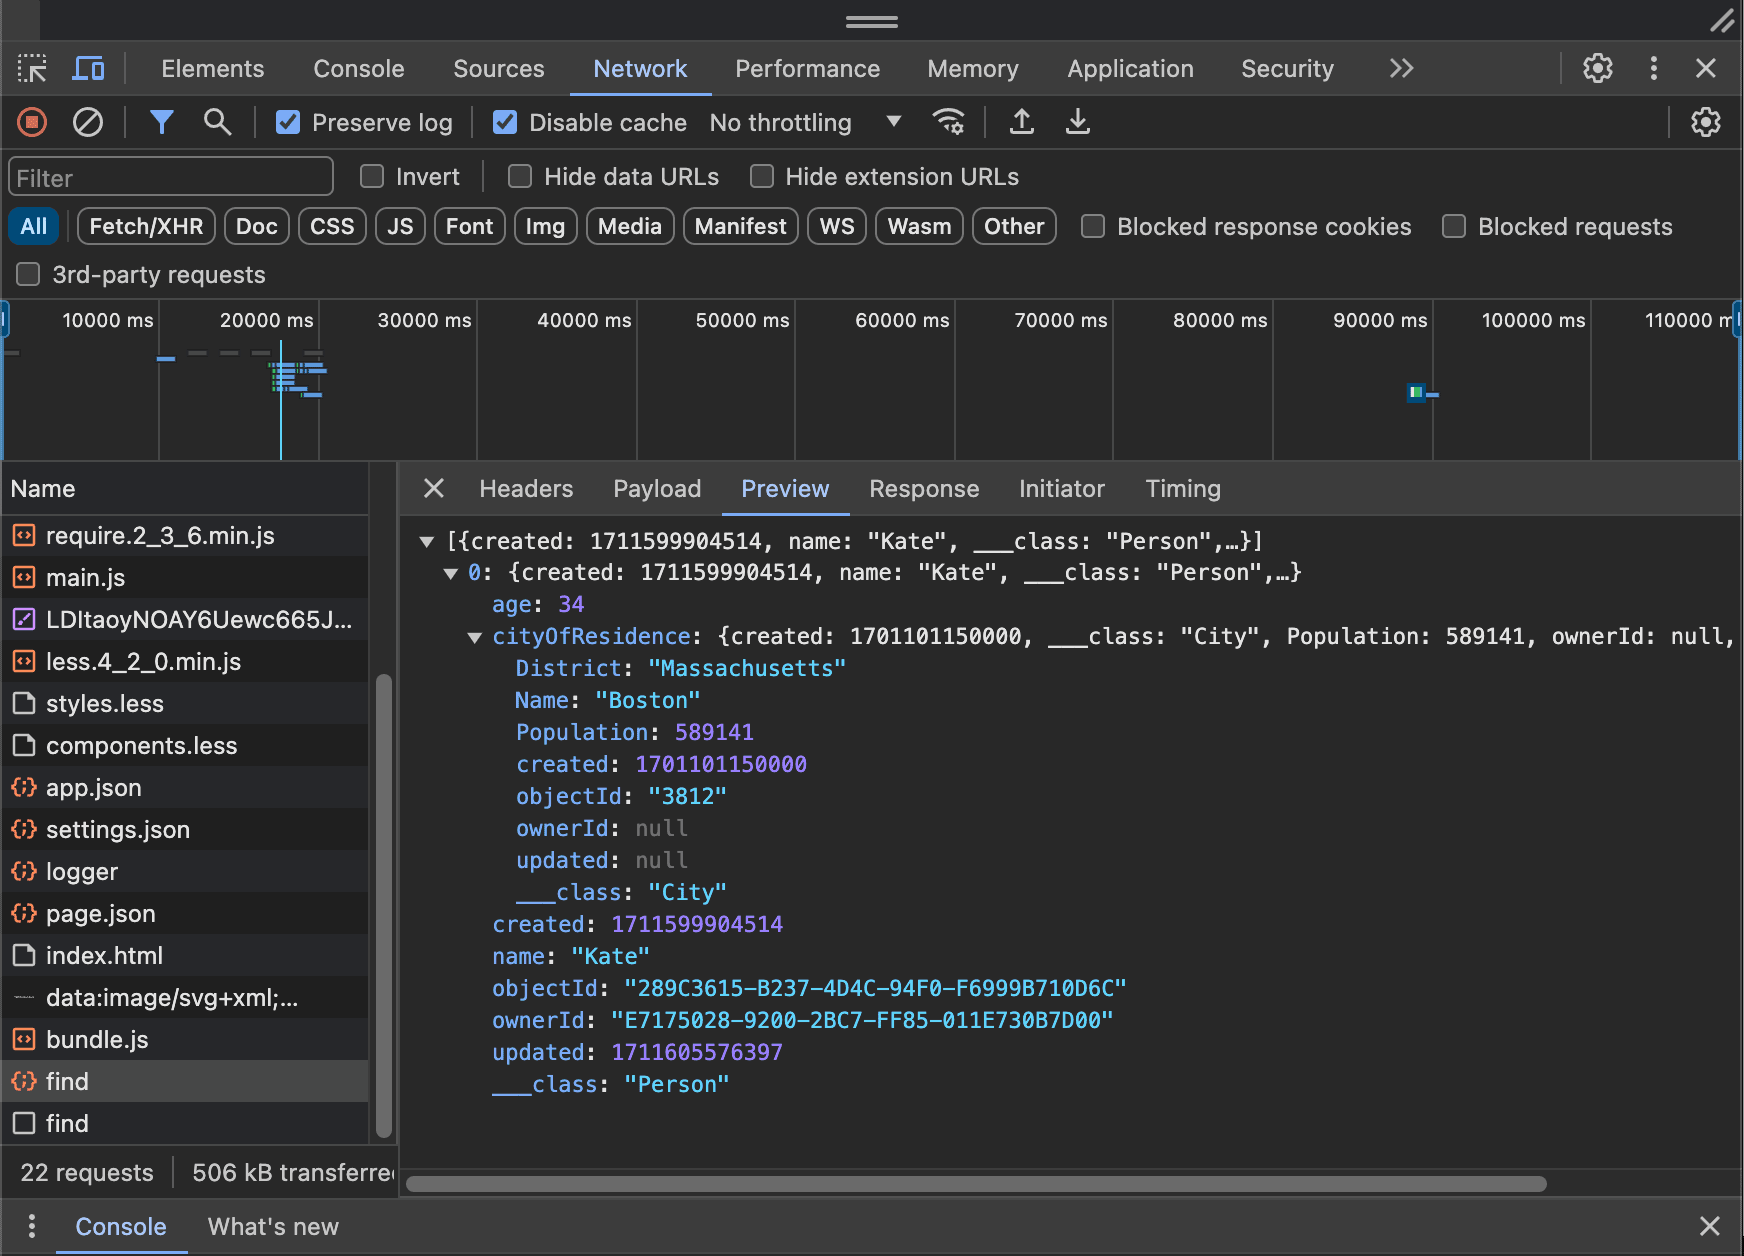
I’m following the Missions task: “Retrieve Related Data With API” and I’m near the end of the video (@10min36sec) where it shows how to monitor the network traffic in Chrome’s Developer Tools. But it just doesn’t look the same for me.

Here is what’s shown in the video:

Here is what I see in Chrome (Version 123 - presently up-to-date):

How can I make my Chrome Dev Tools match what is shown in the video?

Bonus: How to also do this on Firefox Dev Tools? (If anyone knows).

Thanks!

hello @Causality

you can disable cache and preserve the log

Also, are you able to see the data on the page like it shown on the video?

1 Like

Thank you! I am able to see the info now.

In case it is a helpful reference for anyone else, here is what I see in Chrome:

The row with Name:find Type:xhr is highlighted. If it is clicked again, the window frame with additional info (Response, Preview, etc) appears.

When inspecting the Response tab:

When inspecting the Preview tab:

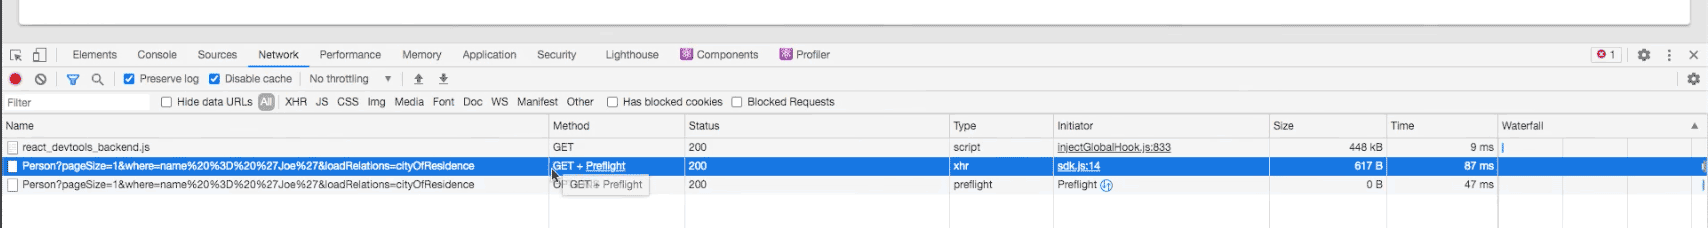
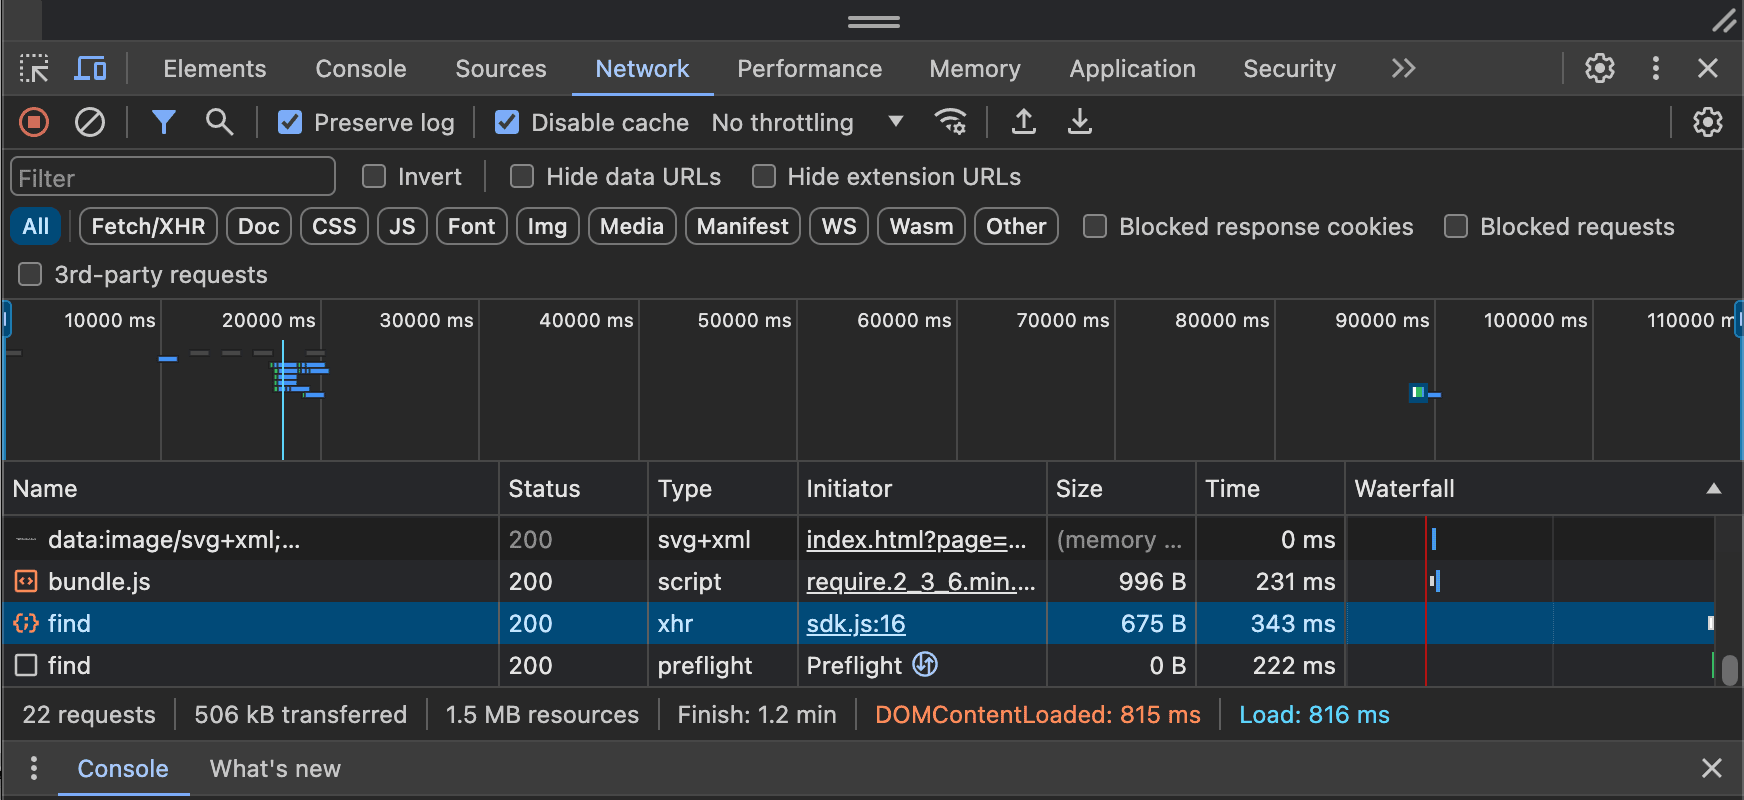
Note: There is another row with Name:find
however it has Type:preflight
Its size is zero bytes. I gather it’s not important, although I am a little bit curious about its purpose.

And yes, I was able to see the data on the page like it shown on the video, and complete the Missions task. Much appreciation for the help. :slight_smile:


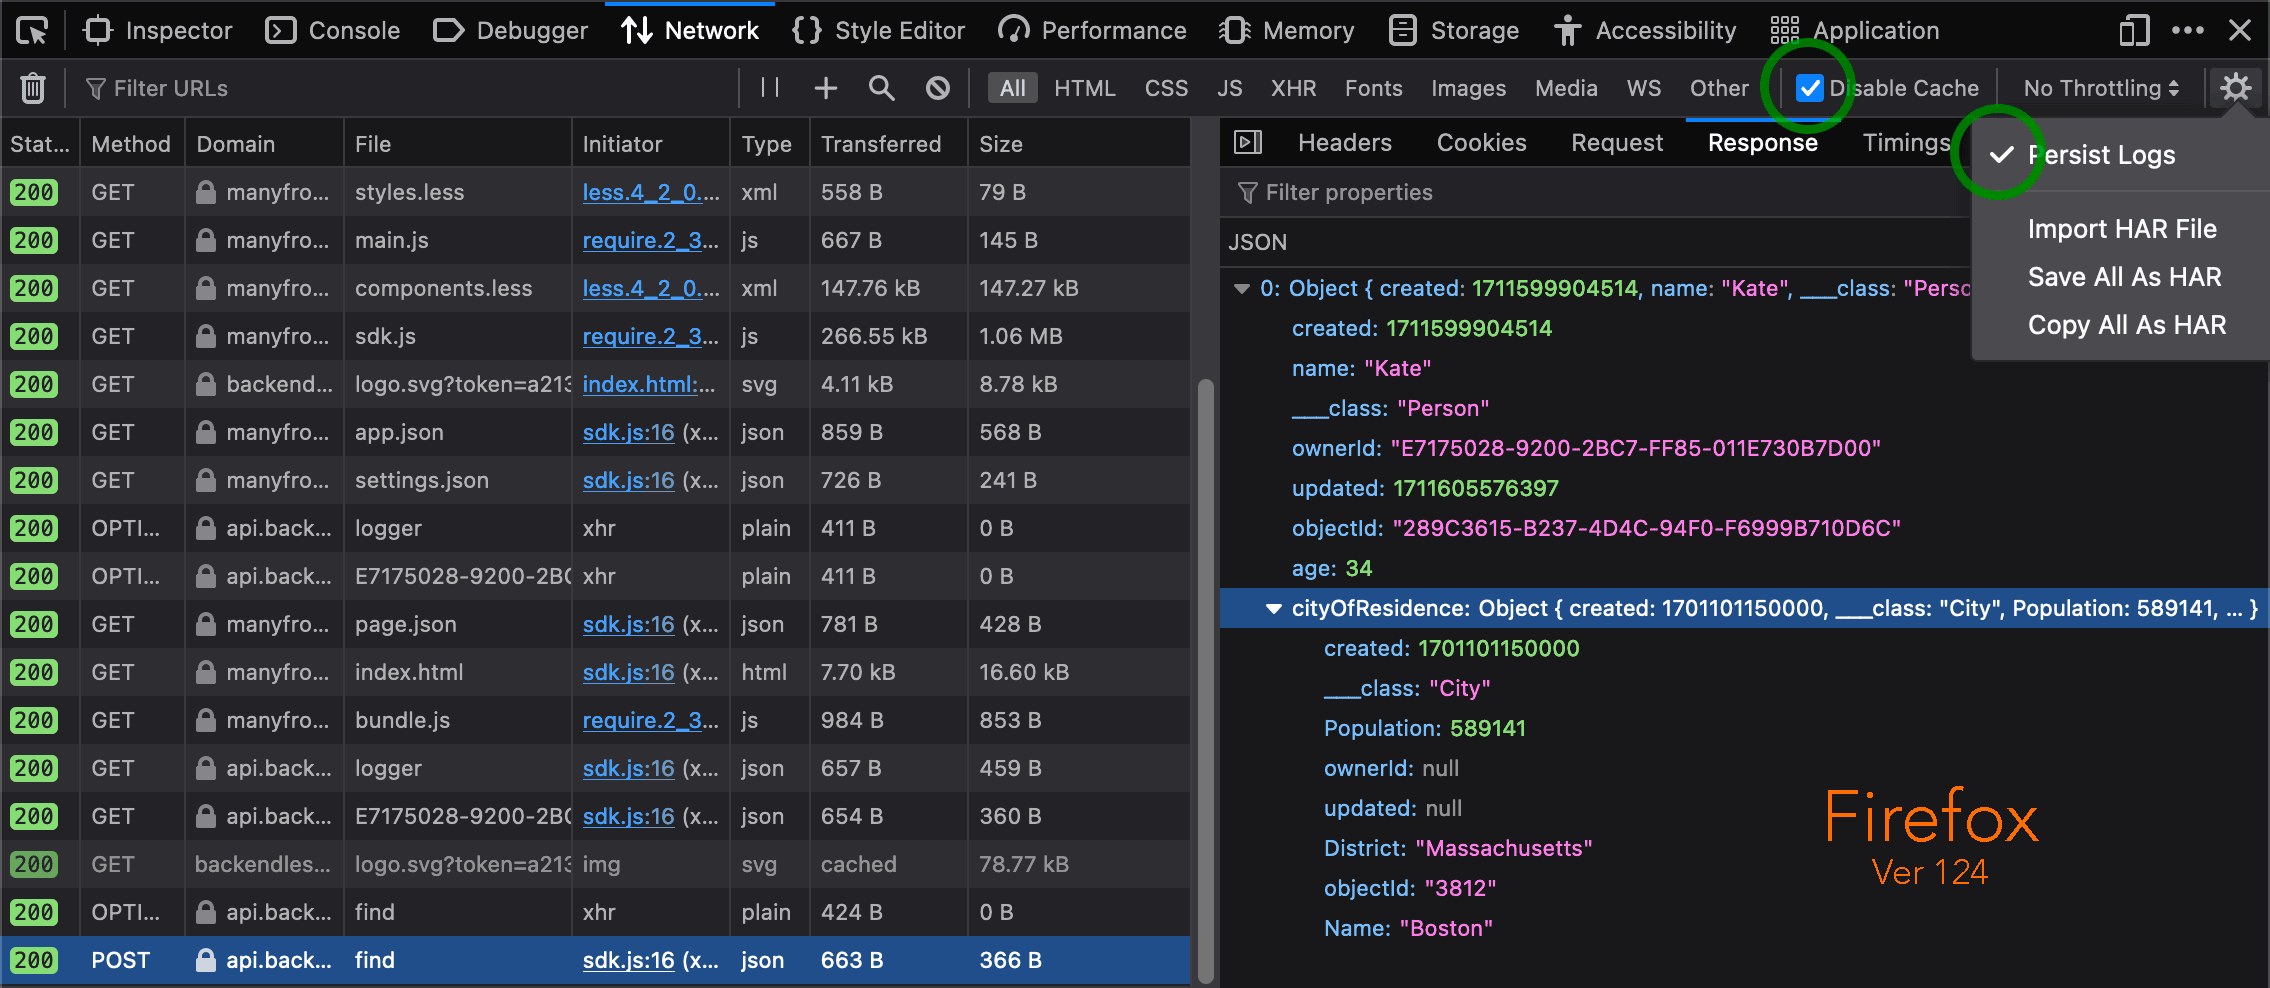
Lastly, for anyone curious, here is a screenshot of how to do it in Firefox:

The Type column value is not xhr but instead json. I don’t know why.
Maybe due to a different convention for labeling/categorizing.