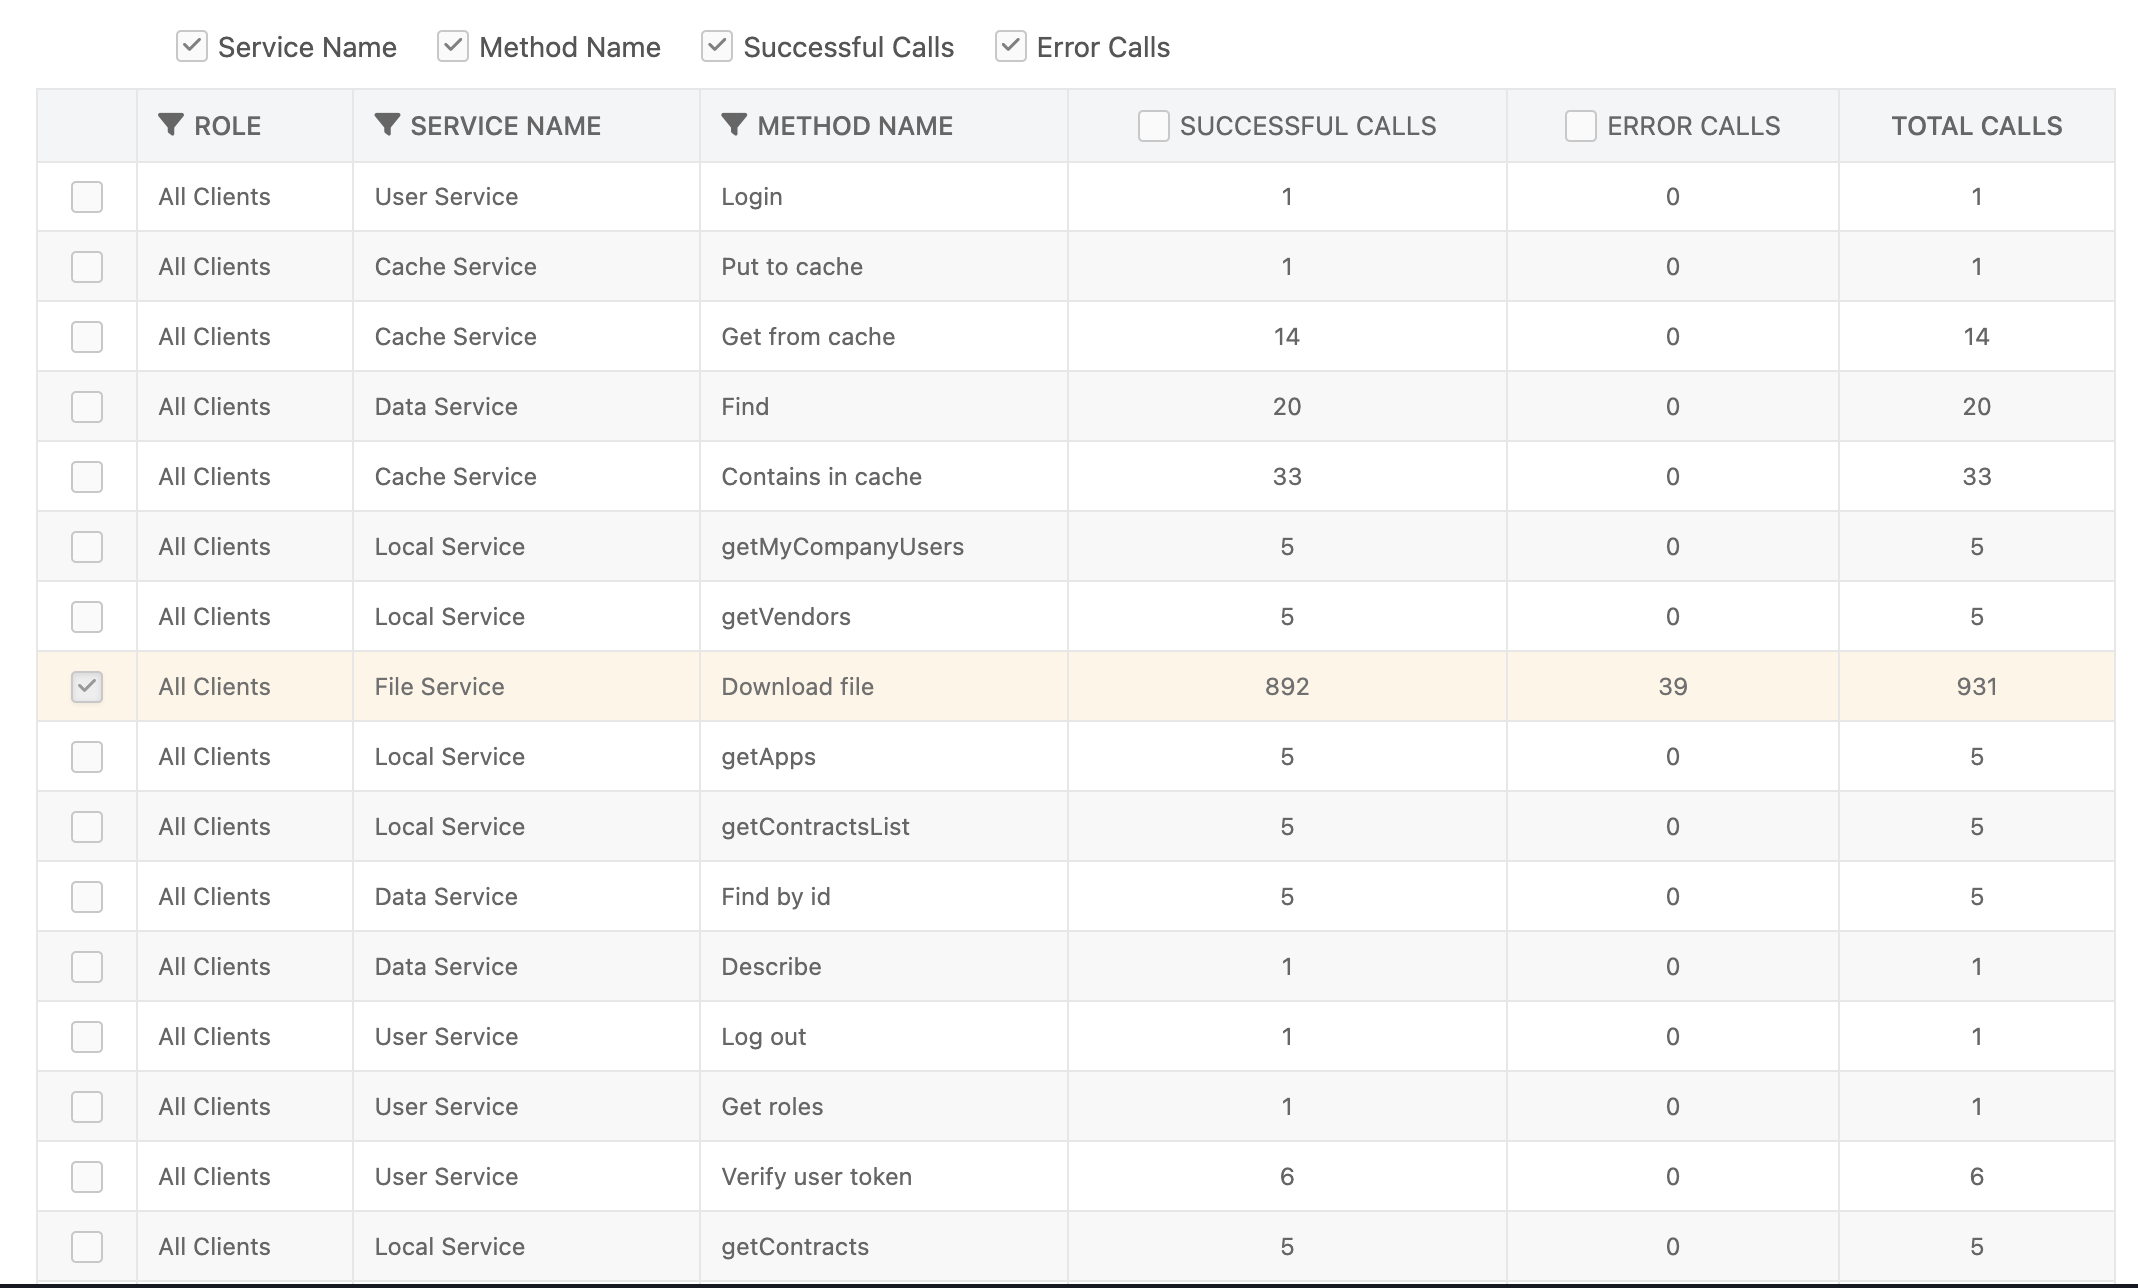
I am trying to understand why I can barely touch one of my development test apps on the free plan - it goes out of API limit bounds in no time. The stats leave little to the imagination as to what causes this - file calls:
But since I am the only one working on this app, and there is no file calls that I know of being made other than showing a couple of images. I have done under 40 page reloads today, and am out of API limit bounds, but for these 40 page reloads I have accumulated 931 file service calls. How is that possible? Thats 23 file calls per reload! All of this is in preview mode.
Clearly I am doing something wrong, and I want to find out before moving this app to towards production. So:
- What is counted as file API calls? Is there a doc showing this somewhere?
- I have asked earlier and understood that multiple css extensions and components should not impact the numbers. Is this still correct?
- Is there a way to debug and find what these API calls are somehow? Is there a doc showing this somewhere?
- Are any operations done in the builder counted as file API calls? If so, what?
- App ID in question if you need to review/look at something:
4919877F-4544-2D4B-FF37-CD72374F8E00
Hello @Egil_Helland
Unfortunately, I am not able to correctly interpret the actions that are meant here.
To make it easier for me to help you, please describe your actions in more detail, something like:
- I went to the Manage-Analytics-API CALLS page, selected the period from to : I see All Clients-File Service-Download file = 450
- I went to UI Builder, there I selected a container with the name app-v1, selected the events page, then clicked the Desktop preview button, I updated the page that opened three times.
- I returned to the API CALLS page, and instead of 450 calls to Download file, I saw 510 calls.
The API call called File Download is counted in the calls described here: Downloading a File via API.
Perhaps these articles will help you:
How to debug and analyze API spikes
API Optimization Best Practices
Regards,
Volodymyr
Hi @Volodymyr_Ialovyi,
I will try:
-
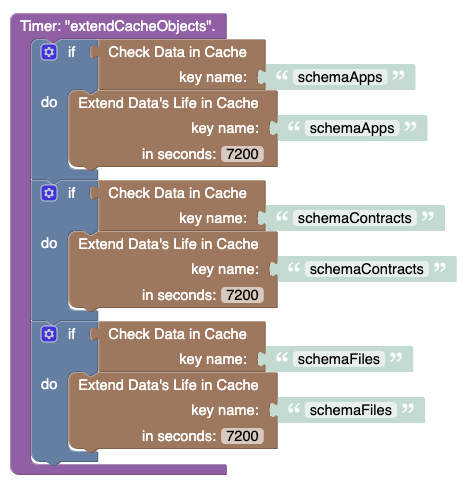
I have not used the app at all today, but I have a timed even updating cache every 2 hours:
-
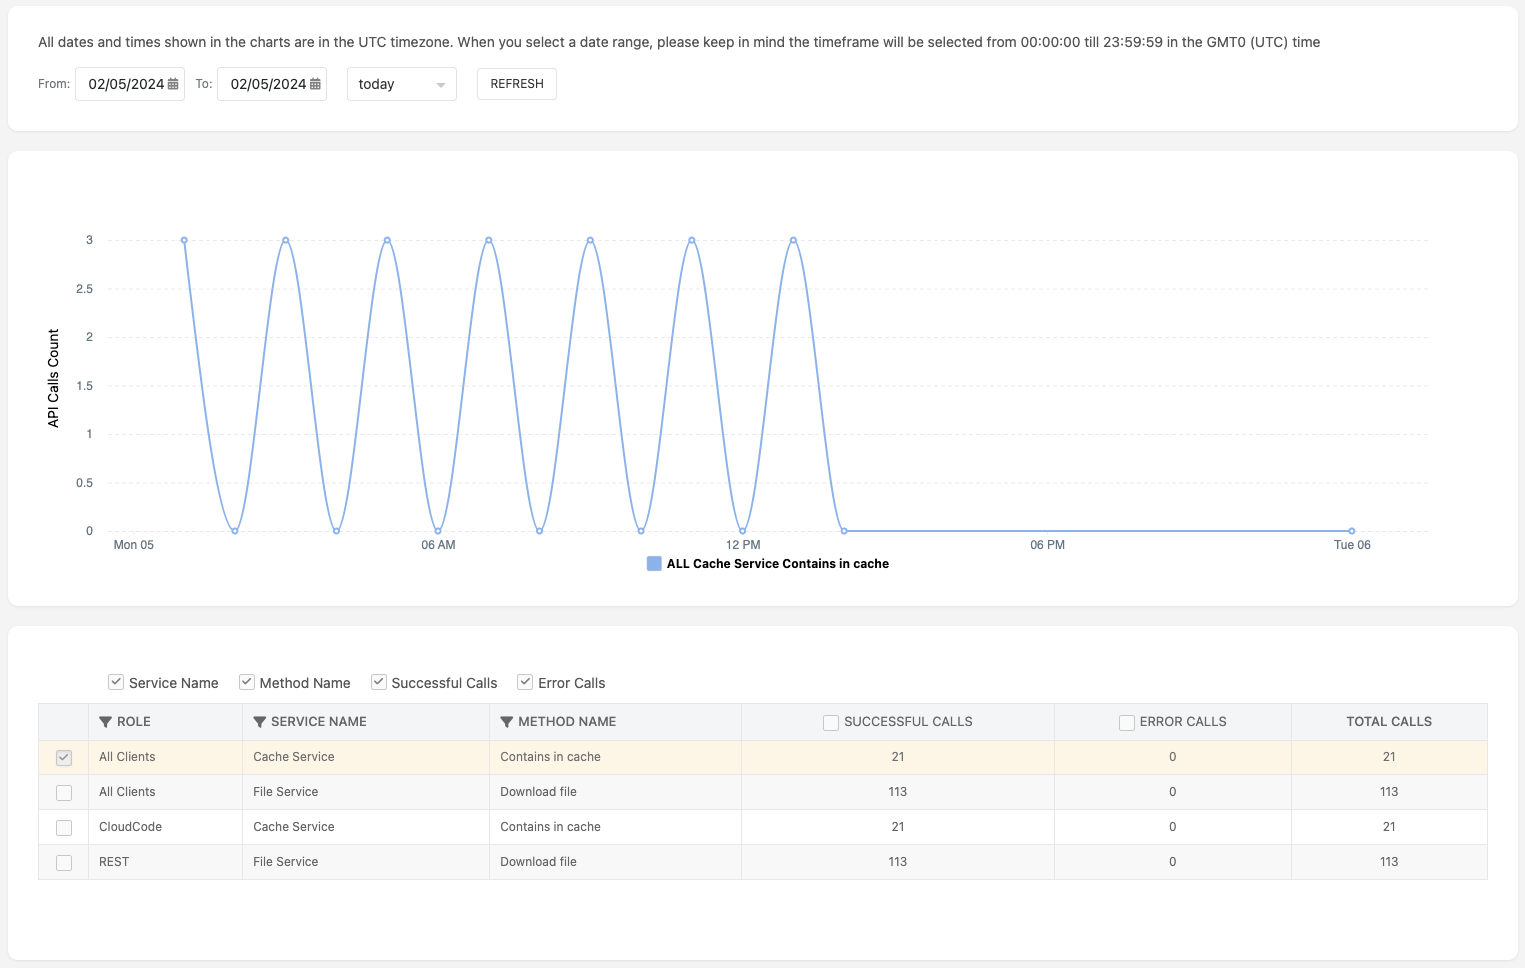
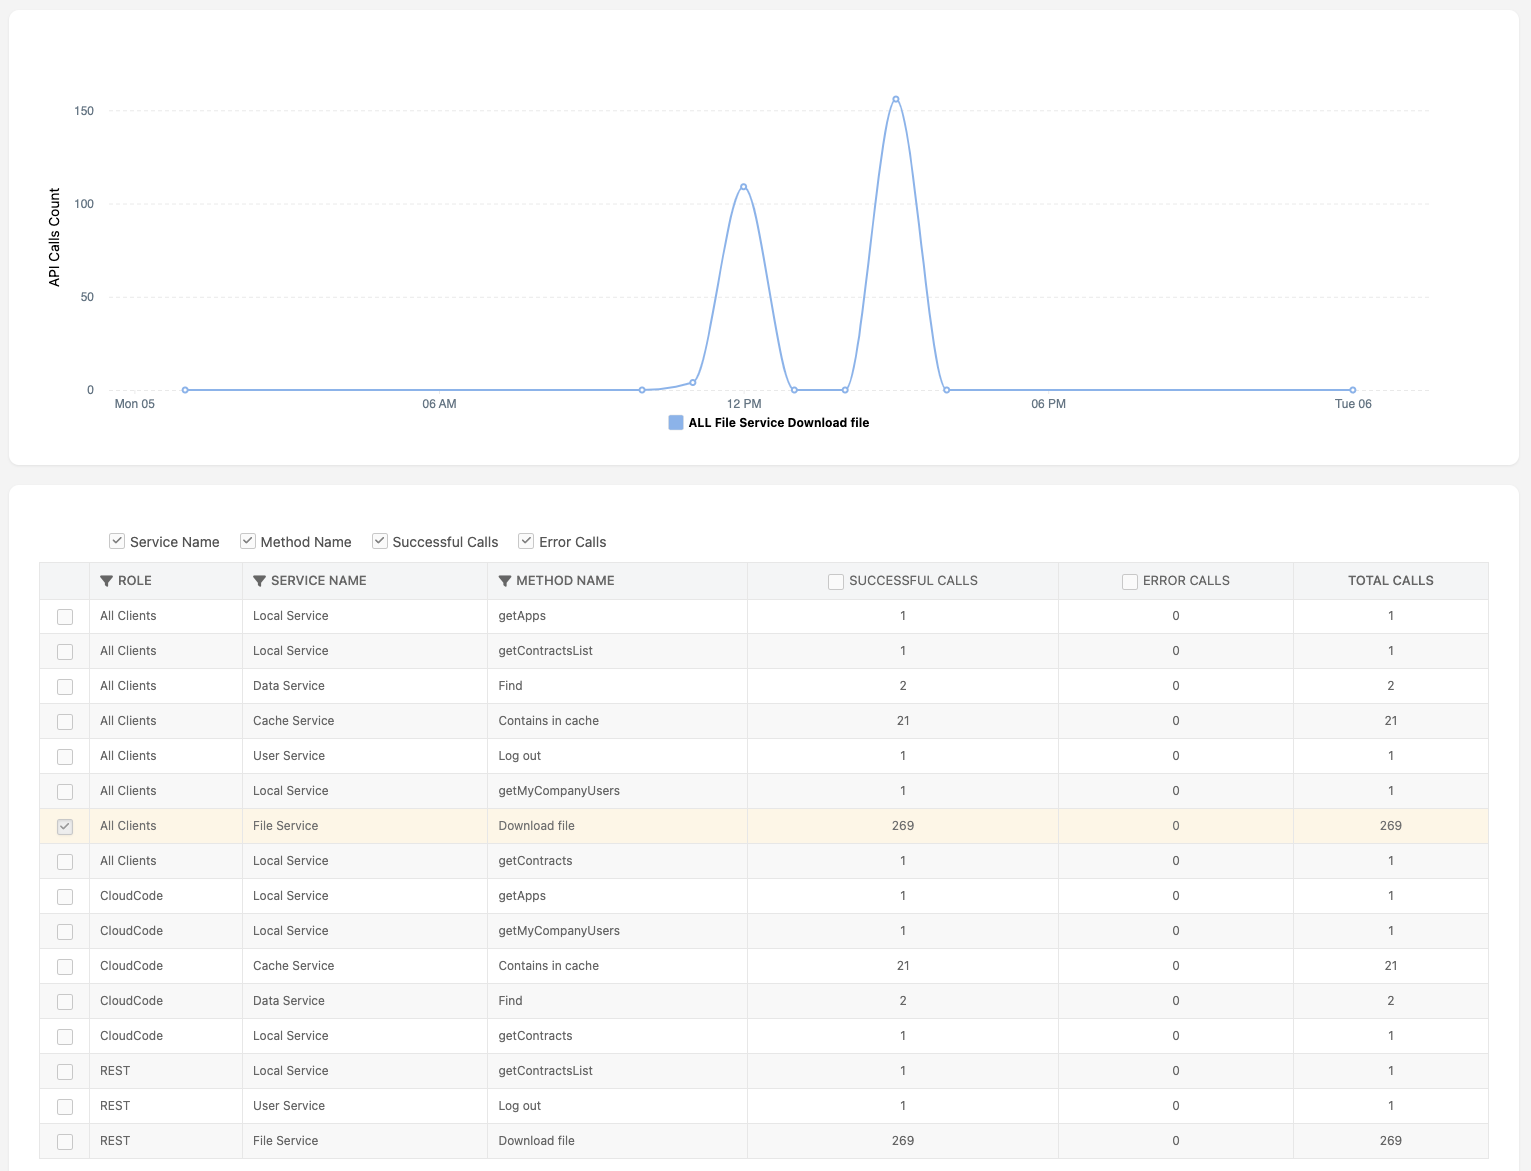
When checking in today to see how many API calls my app has, I went to Manage - Analytics - API Calls. This is what I see:
The number of API calls are exactly like expected, corresponding with the graphs and the 2 hour intervals from midnight to 1500 hours - 7 times 3 updates. but not the downloaded file calls! The only thing that has been happening in the app is the cache update calls. My expectation is that 0 files should have been downloaded! Instead there is 113 calls - which are not dividable by either 7 or 3.
Does that help?
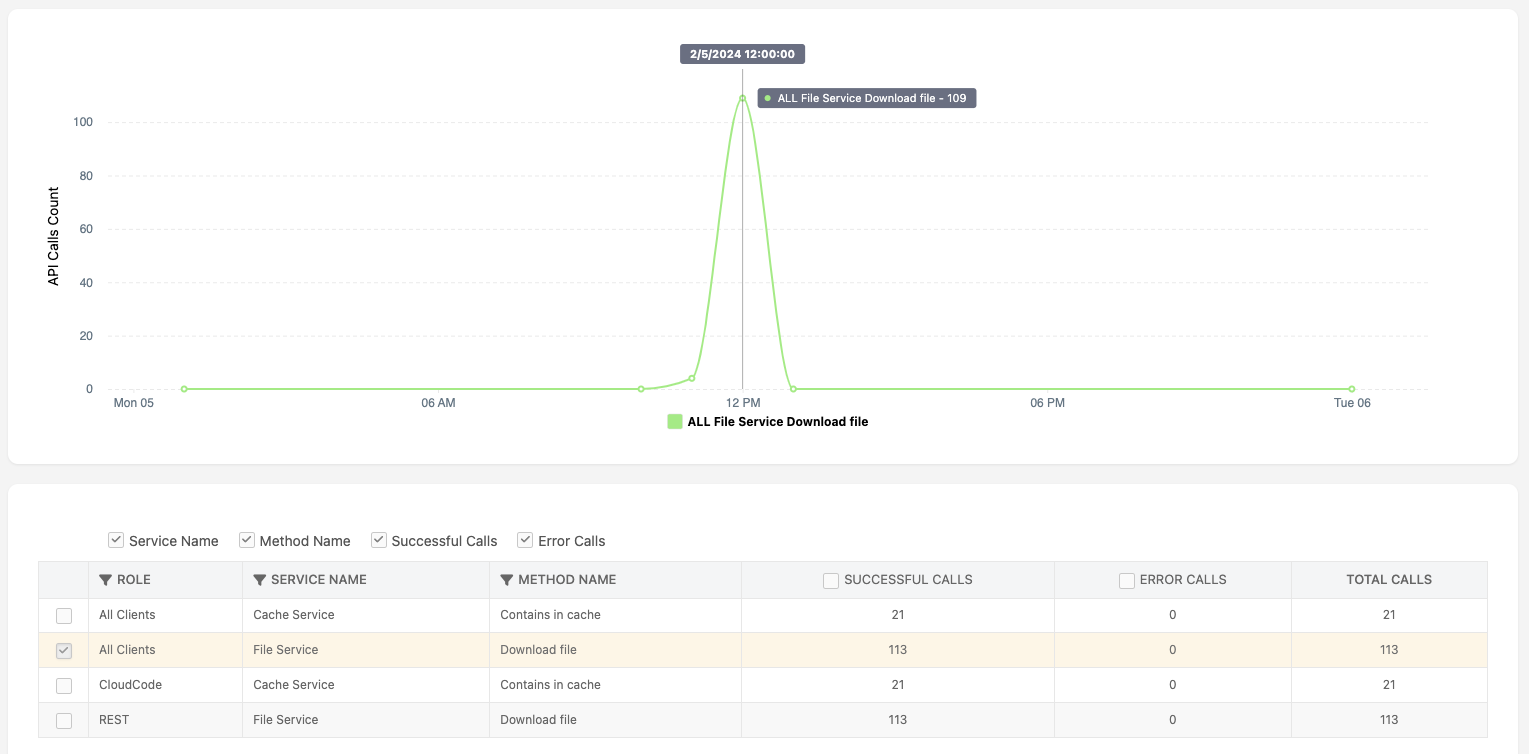
One more thing - The File calls are all coming at 12 PM (well, 4 of them just before there):
Again, this is without any users using the app.
I suspect a search engine bot causes the file download activity.
I tried now this:
-
Go to one of my pages in App Builder (contracts), and then click Open in Preview.
-
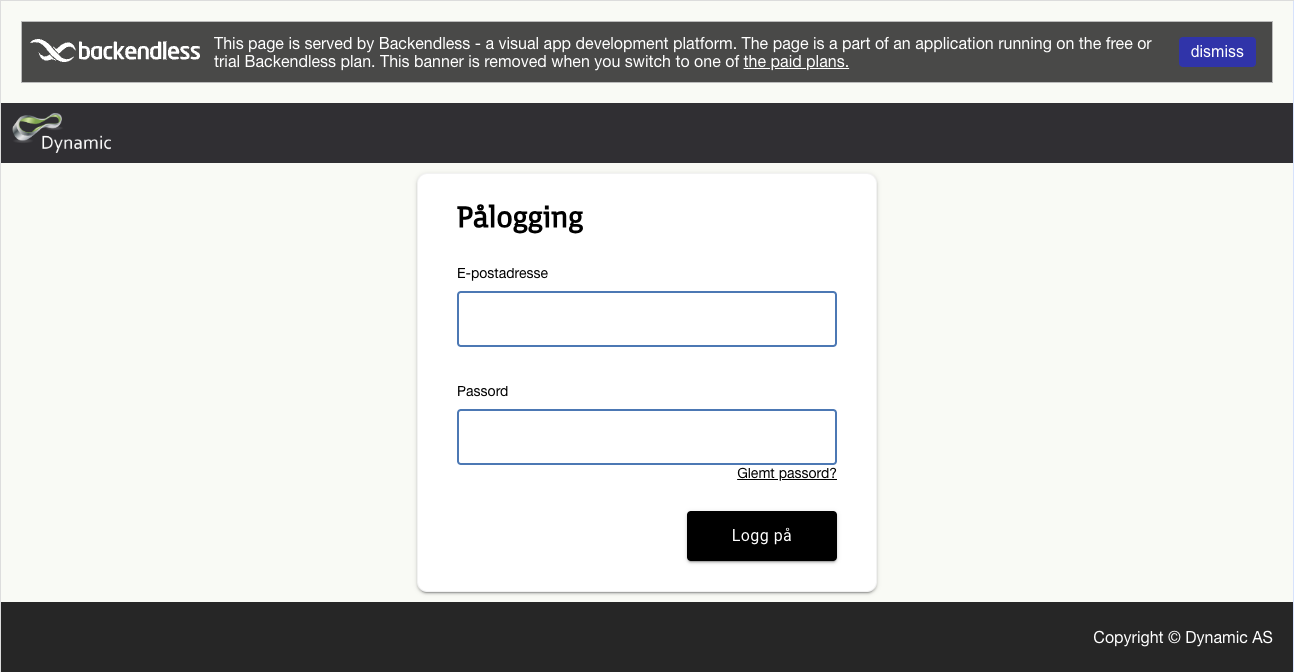
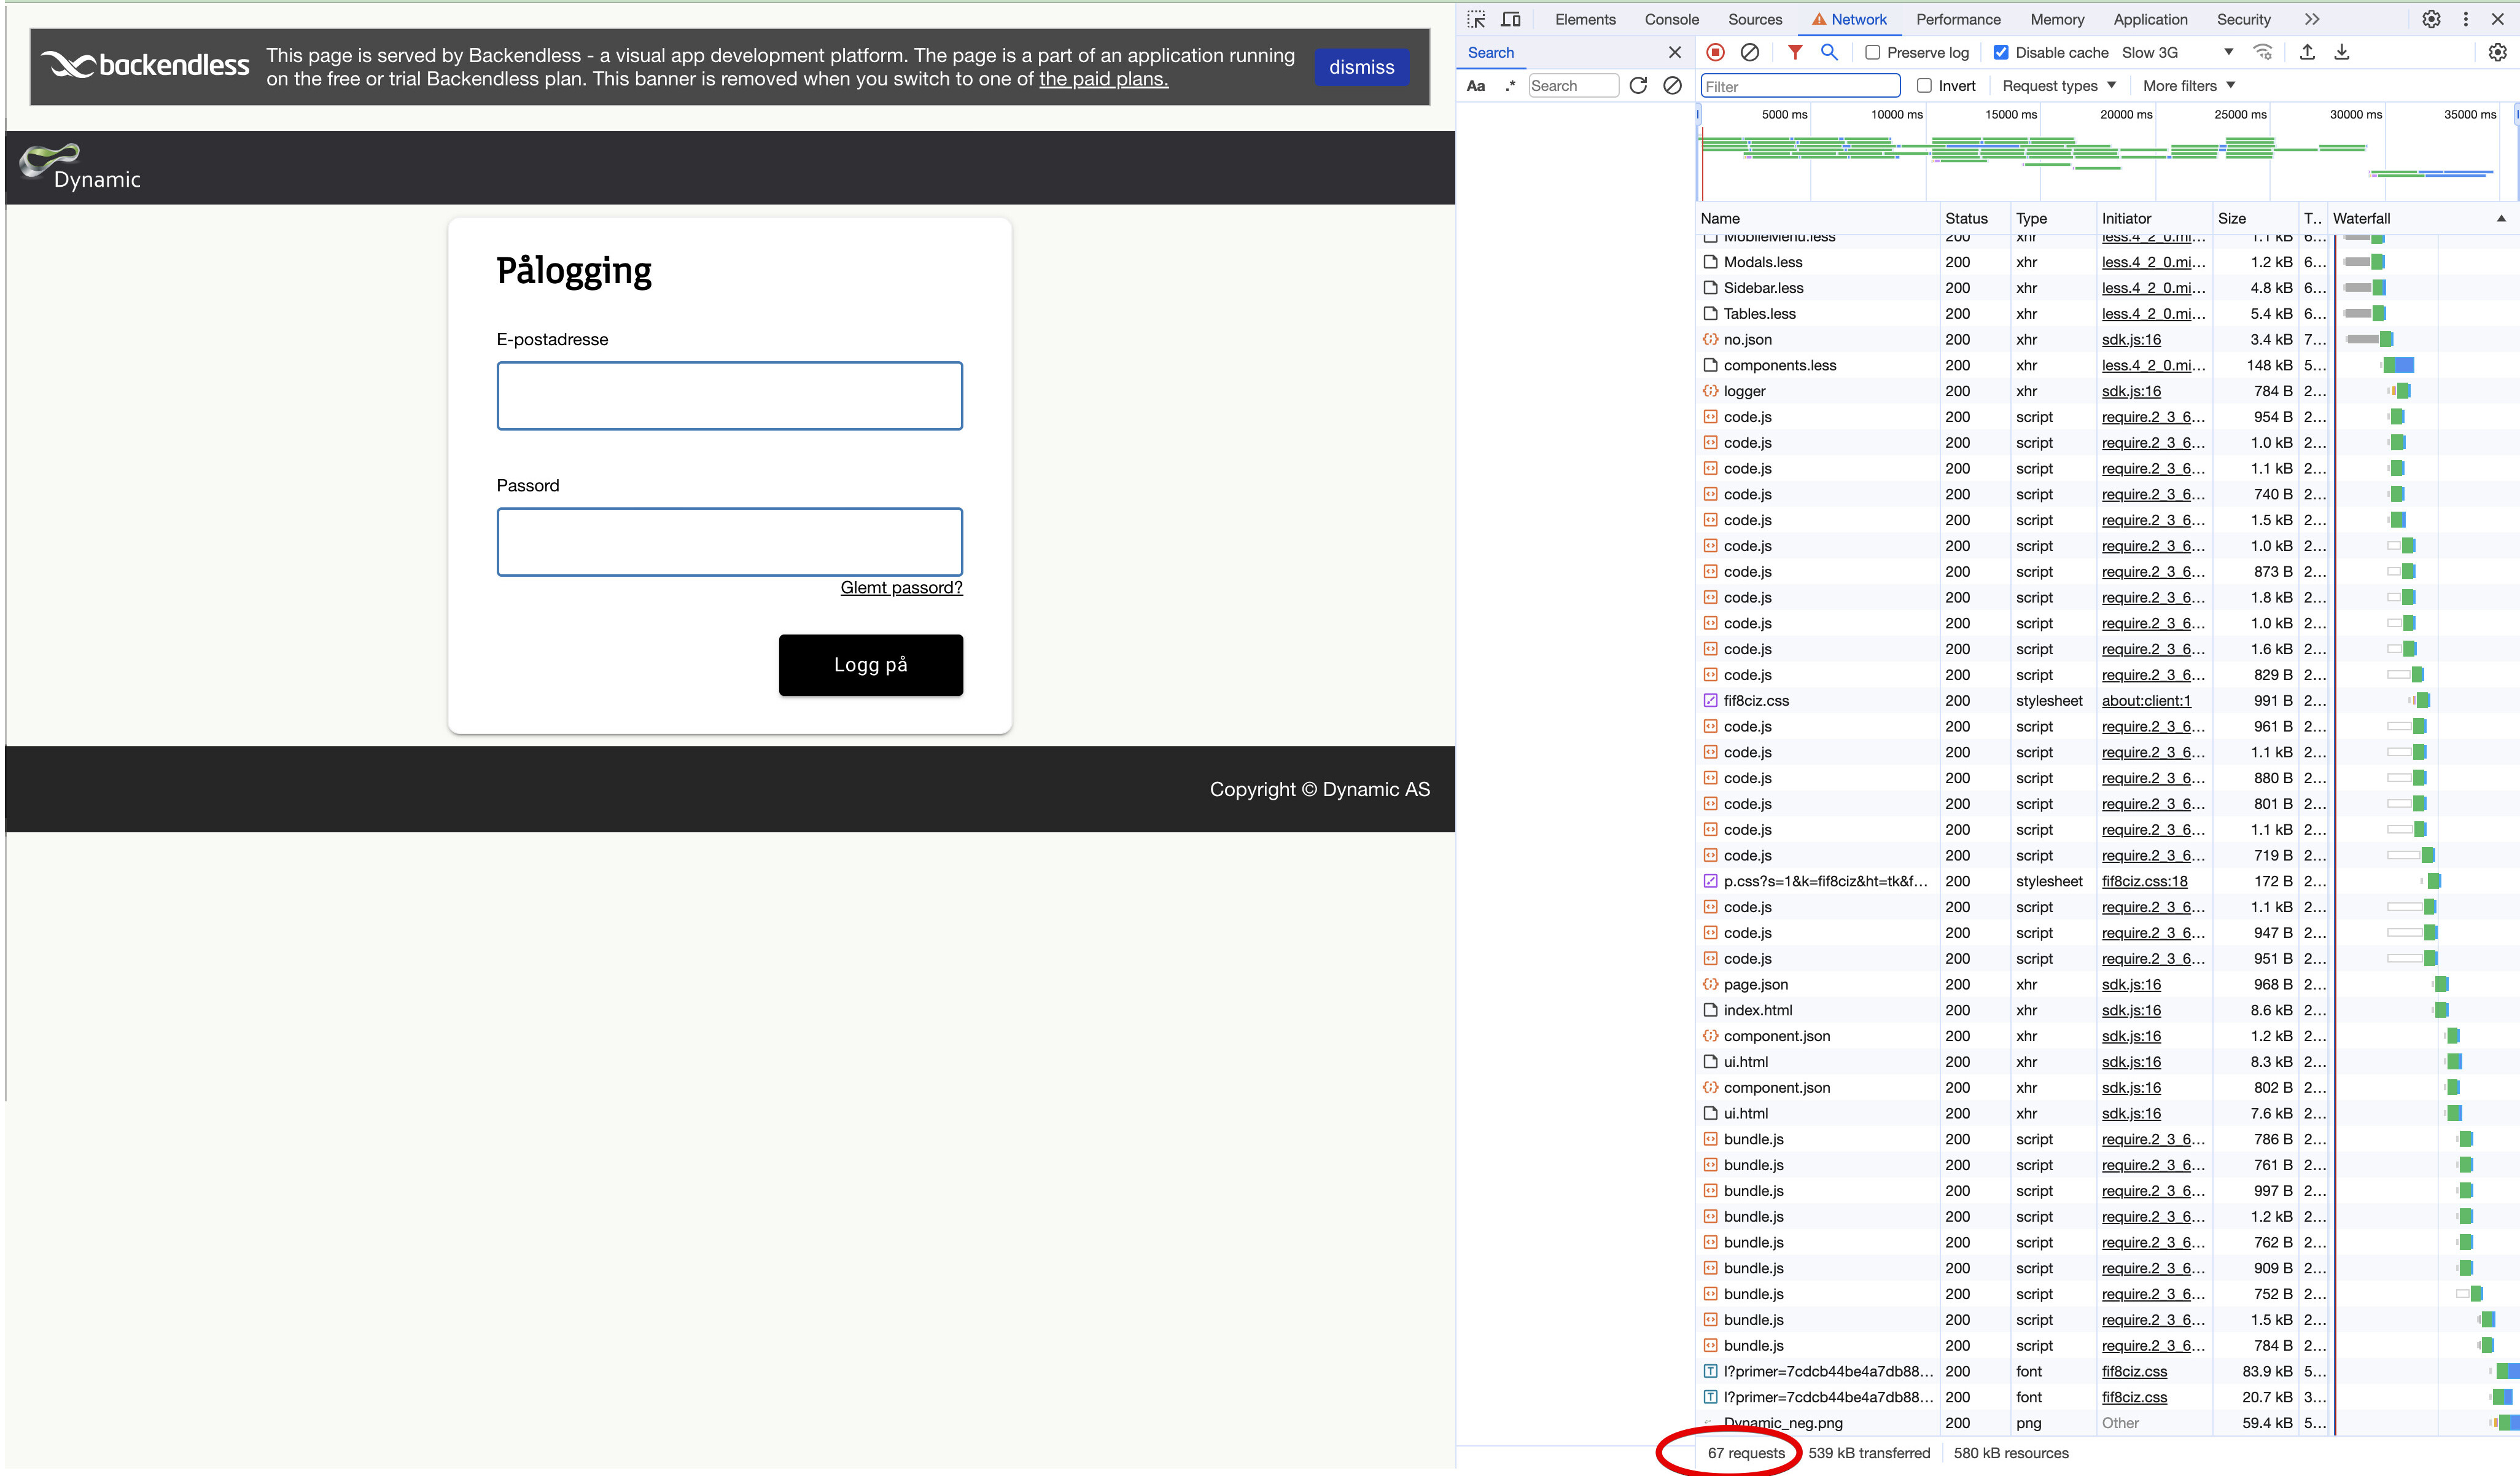
When the page loads, it will redirect me to the login page since I am not logged in. I expect to see some API calls for this. The login page contains 1 logo, rest is css, and there should be 2 font api calls. So let us say something like 10-20 file calls to be generous. This is the page that is loaded:
-
Without doing anything (not clicking on anything after page load completed), I went to Manage - Analytics - API Calls again. This is the result:
That means that the single page load (or 2, counting the redirect) results in 156 file calls.
Clearly I am doing something seriously wrong… But what? 
A single page will reference CSS/JS/fonts/images/etc. Every single fetch of the related files is a file download API request. So yes, a single page load may result in 156 calls.
Tried again now with just the login screen: 66 file calls showing up in Manage - Analytics - API Calls. My Network inspector however only shows 31 requests over the wire. Are there maybe more internal calls that I don’t see on the client side?
Is this counted/working differently for apps that are in preview mode vs deployed? Or will the numbers be the same?
If not, I guess this means that if 10 people just goes to the login screen of my app within the same minute, but does not log in, I am at pricing level 9 on the scale plan? I understand that running with caching is key to have cost control and still a functioning app, even with just a handful of users, but I did not realize it was this important…
Hello @Egil_Helland,
Thanks for waiting,
Does this count/work differently for apps in preview versus deployed apps? Or will the numbers be the same?
The file download counter works the same for both preview and publishing applications, the only difference is that the preview mod has more files which are merged during publishing for optimization purposes
We also analyzed your situation and can share with you the results for your “app-v1” container.
Loading a single login page in preview actually took 67 requests, but once the app is published, this number drops to 15. This means for 10 concurrent users, the TIER value will be less than 9
Regards,
Sergey
1 Like
Thanks for clarifying this Sergey, then things makes a lot more sense to me based on my other app in production already.
I had the impression preview and published applications were handled equally, so I did not understand how this new app could behave so differently that I was sure I had done something wrong.