I have an app page displaying a DataGrid component. When we display the page with data and then leave it at rest while the user decides how they would like to react to the data, the page emits “Maximum request per minute limit has been reached for the app. Current limit is 500 requests per minute”.
Hi Richard,
The message the page shows comes from the backend. The requests which put the app over the threshold are cumulative from all sources, which include all other pages and any cloud code logic you might have.
There are several ways to see what that API activity is:
-
Backendless Console - navigate to the Manage > Analytics and select the “API CALLS”. The page will show a list of request types the app received.
-
Server side logging - the log files are available in the Files section of the app. Navigate to the “serverlogs” directory. There is a log file for every calendar day. The log files will show what API services or timers are running.
-
For the UI pages - when you open a page, open the browser’s DevTools and select the “Network” tab. It will show all the client-server activity of the page.
Hope this helps.
Mark
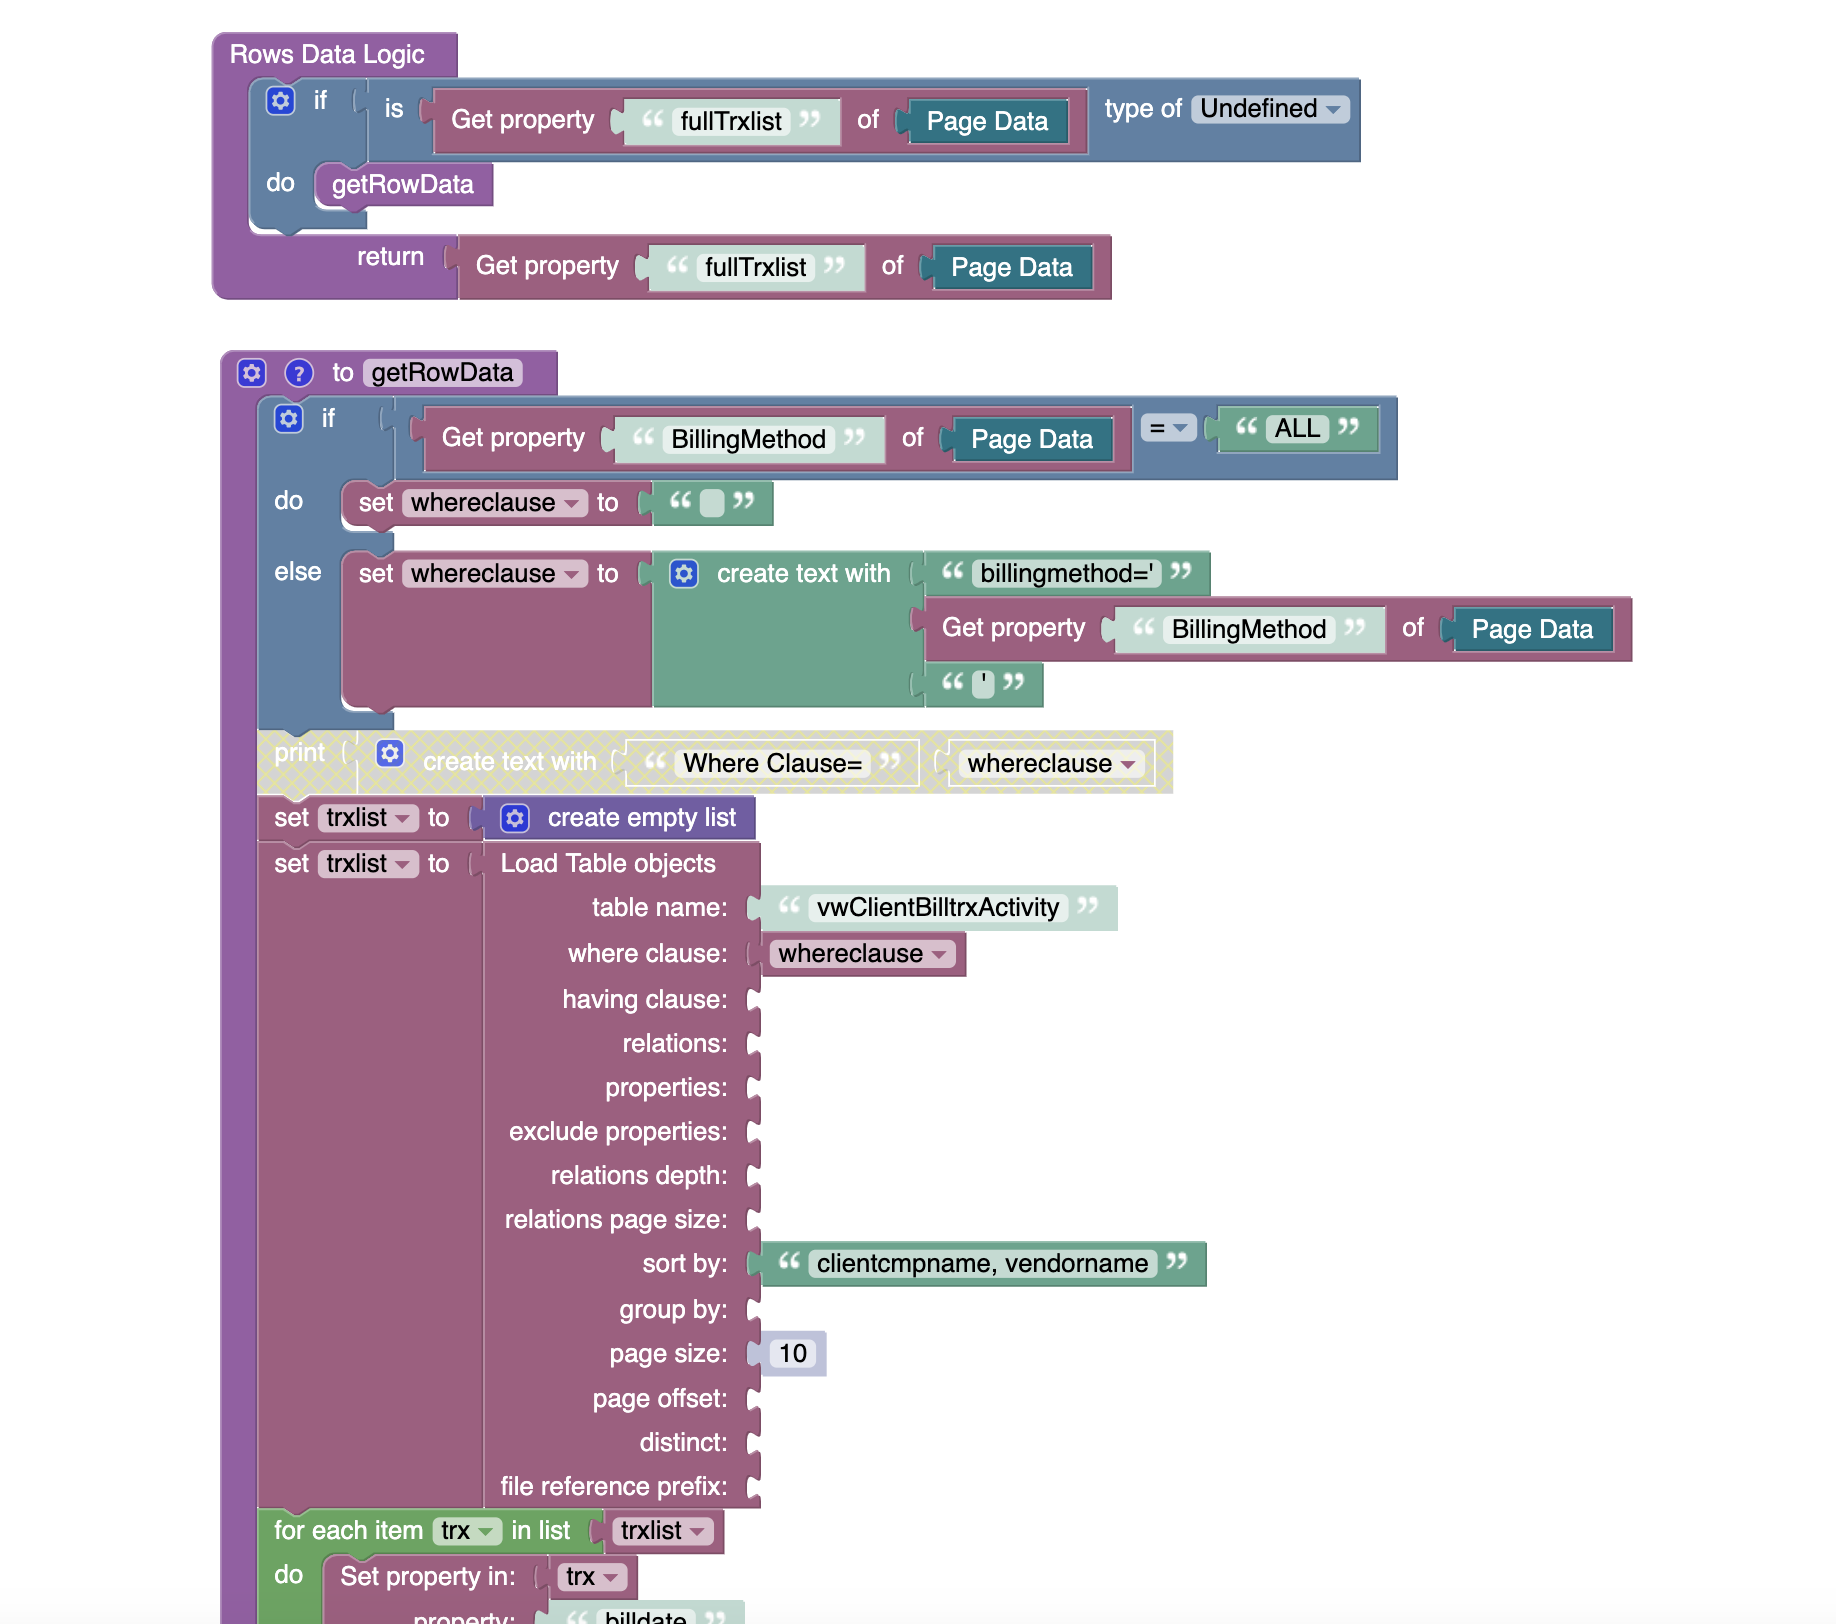
The Backendless Console (Manage > Analytics) has identified a FIND operation as the cause of the excess. I believe this is caused by the ROWS logic of the Data Grid and/or the VIEW used as the data source. I then changed the “Page Size” param from 100 to 10 to see if this would limit the overage event, but it has no effect.
If changing the pageSize didn’t help, you would still need to find the source that triggers call concurrency limit.
On-Page-Enter has no data calls
The Left-Side-Menu has no data calls.
The Radio-Button-Group has no data calls.
The Data Grid has the above Row Logic. The data call is set for a single pass and now has a 10 record limit.
The Submit Button contains API logic but has not been pressed yet.
The DB View only has 3 records in its source table.
The error message is displayed approximately 20-30 seconds after the Data Grid is displayed.
Just trying to understand the scope of the issue - are you saying Backendless is counting the calls of your app incorrectly?
I’m saying that “something” is generating this overage of DB calls, but it is not apparent within the page, or at least it is not blatant. It looks like it is something caused by one of the components I am using, something that is behind the scenes, I just need something to reign in the overage, because it will be a common occurrence for the user to park themselves at this page while they view the data. Background leakage should not be running up the usage meter.
The most obvious way to understand where the calls are coming from from the UI perspective is to inspect them through the Network tab of the browser’s DevTools panel.
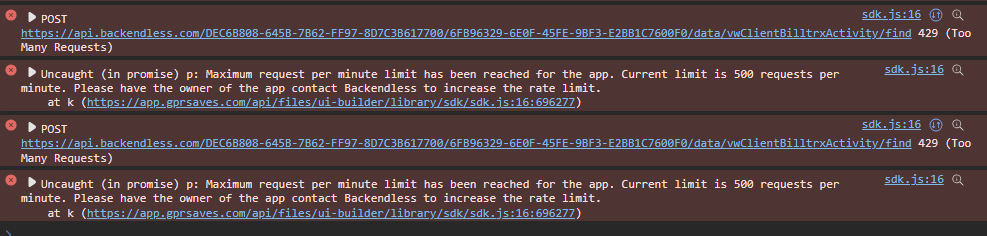
The Network tab shows a continuous stream of:

up until the point that the max limit is achieved. This begs the question as to What would be generating a find operation on this page?
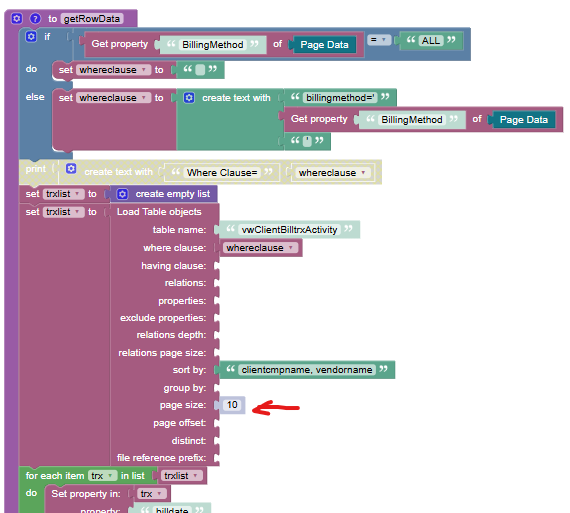
- Data Grid Rows Logic contains a Load Table Object that refers to a Data Table View
- Data Grid Width Logic sets the component width. I assume this is only called when there is a screen action or mouse move.
- Nothing else should be running until the user does an action.
Hi @Richard_Munger,
could you please create a simple example on a separate page that demonstrates the issue?
Also, please provide the App ID, container name, and page name.
Based on your description, it seems that some state is being constantly updated, which keeps triggering this function.
Regards,
Sergey
App ID = DEC6B808-645B-7B62-FF97-8D7C3B617700
Container = default
Page = bo-sendach2
I found the issue. Usually, we recommend loading data on page load in a handler, for example, On Page Enter. This way, the data will be loaded once, stored in the Page Data, and the specific component will retrieve it from there. In your case, you could also change your approach, but to make it work right now, I’ve added a check: if the data is already loaded, we return it immediately.
Regards,
Sergey
Thank you for your reply. Your answer addresses the issue of the continual execution of the OnChange Event for the Grid component however, your solution disables the Radio Button Group. I will adjust for this and will move the data acquisition to the OnPageEnter to prevent the continual Find operation.