Hello community.
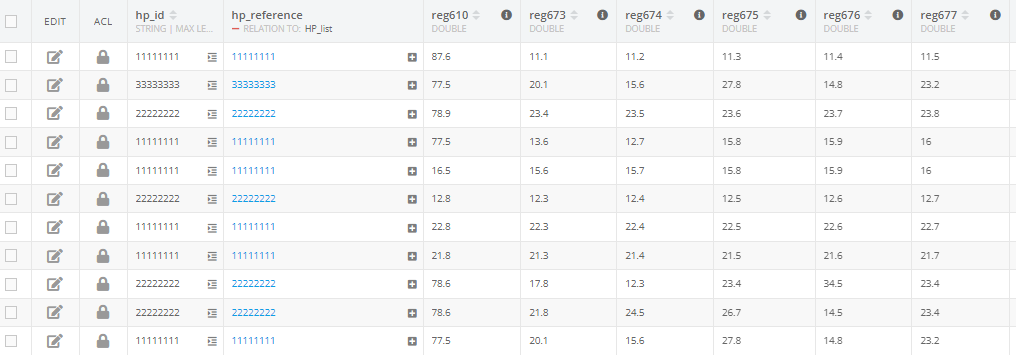
I have table, that contains ID of device (hp_id or hp_reference) and number parameters that should be displayed in chart:
I want to provide end user with next possibilities:
-
To type device ID (hp_id parameter) and get corresponding to that ID data (for instance he types ID = 11111111 and get displayed on chart all paramterers that corresponds to hp_id=11111111 - X axis is time axis). We can do that by typing corresponding text in ‘Where Clause’ field in Backendless chart menu (end user should not have access to it). But I did not find that option in Backendless codeless environment.
-
To change time range (X axis). For instance we want to see value change dynamic from DT to DT. That option I did not find even in Backendless chart menu.
-
To change name of parameters (only in chart). For instance we want to see Inlet and Outlet temperatures names in chart legend instead of reg673 and reg674.
When I select preview of UI with chart I see something like this:
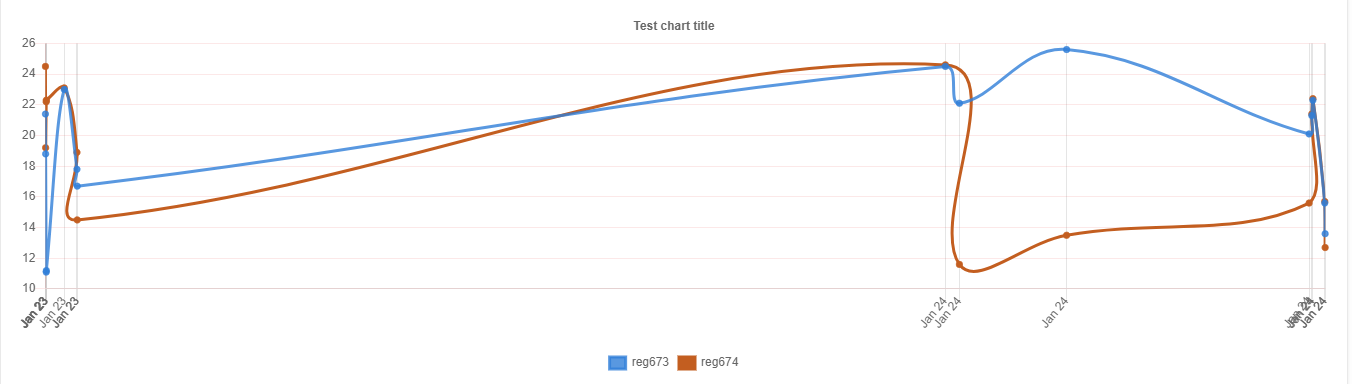
No options for chart adjusting are available.
Is it possible to execute tasks above in Backendless? If yes, how can I do that?