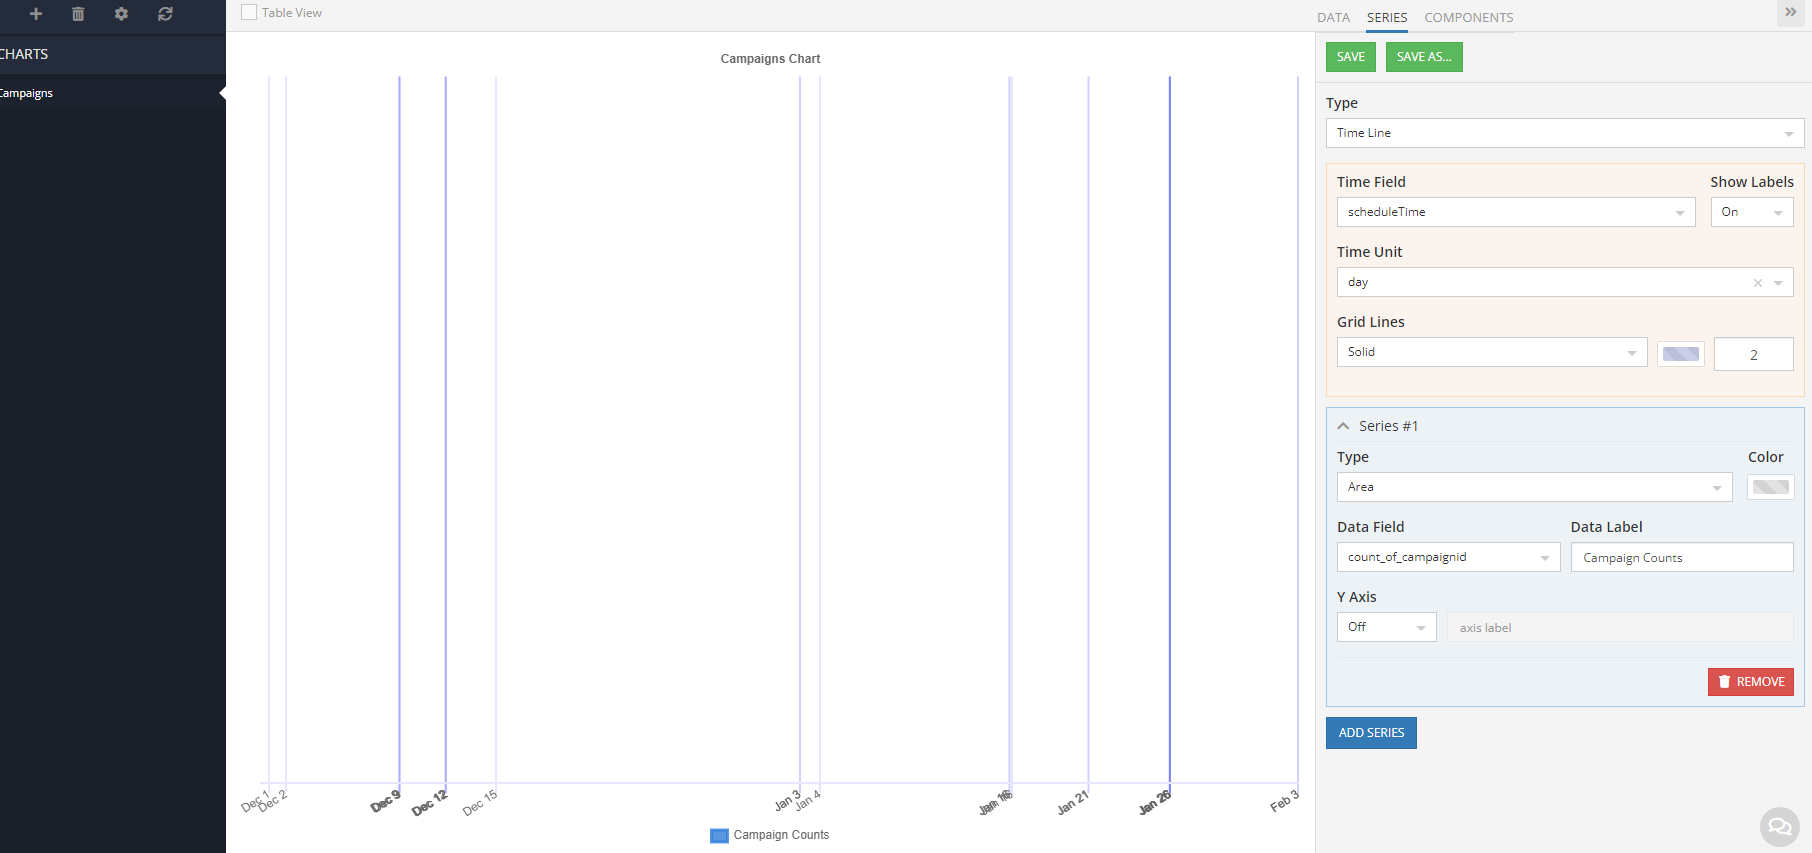
I have following graph, I believe from the intensity of the color I can tell that some days have more campigns that the other days. How can I plainly show #of counts of campaings per day?
Can you please help with chart?
Hello @Sanjay_Christian
You could create a Generated column with the next function: DATE_FORMAT(created, '%Y-%m-%d')
Based on this column we can create a query in Chart Builder.
Add a Count for objectId, and group by generated column.
Please, let me know if it didn’t help you.
Thank you! That worked!