In this recipe, I will demonstrate how to use the Grouping API and process its response to render grouped data in a UI Builder app. Below is a brief overview of the final result:
The Grouping API enables retrieving data records grouped by one or more criteria. The response structure is nested. It may appear complex initially, but don’t let it discourage you. It makes a lot of sense and works great with UI Builder to visualize the data. As you will see by following the instructions below, the logic needed to recreate the demo shown above is minimal.
Import data
Let’s get started by importing the data first. Download the following file:
Product.csv (17.6 KB)
Navigate to the Manage > Import section in the Backendless Console and click the button for the Data Tables import:
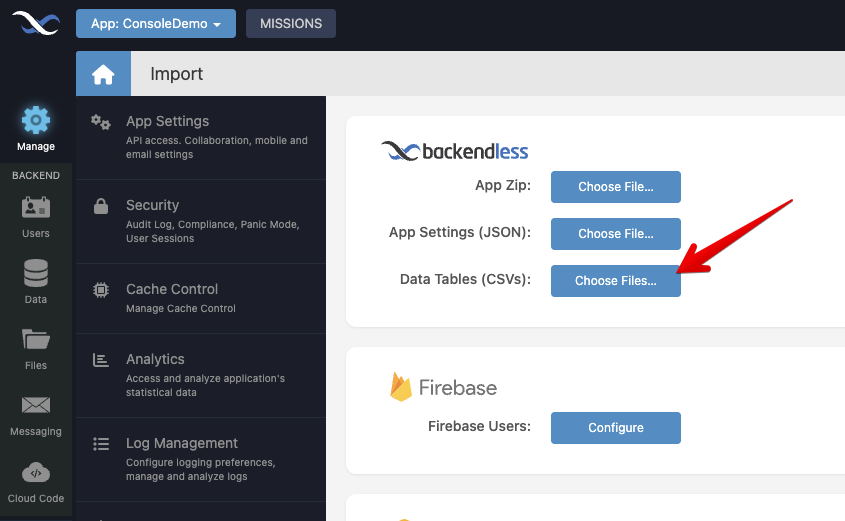
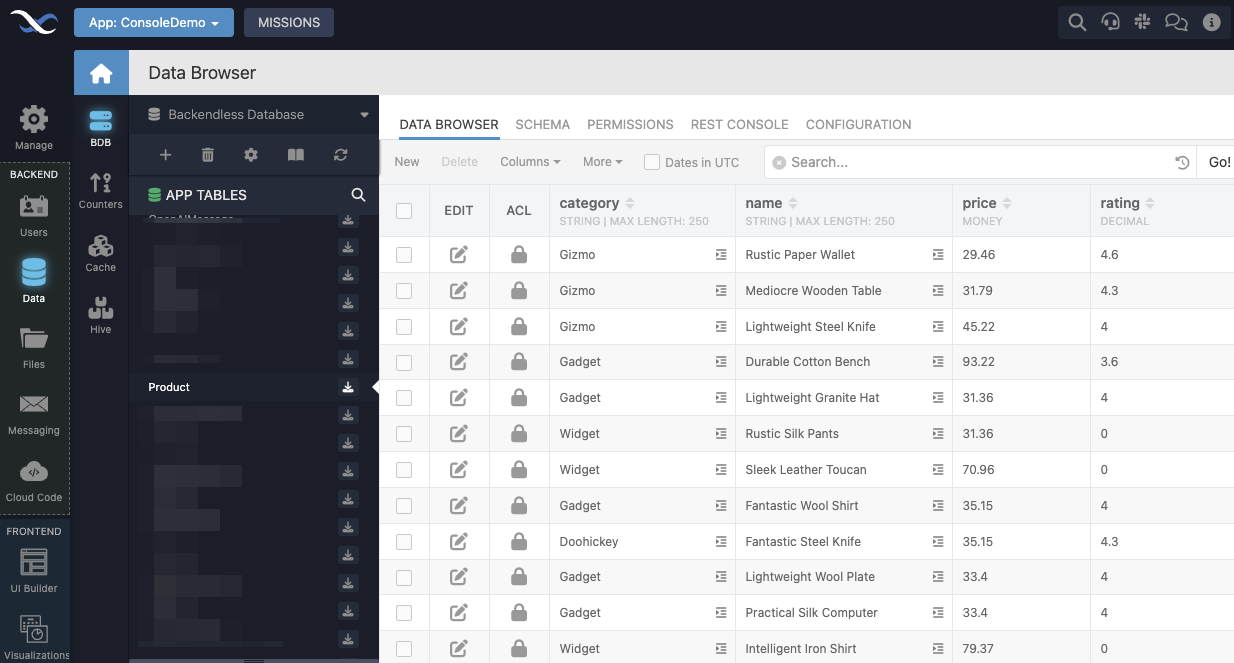
proceed with the on-screen instructions to finalize the import. Once done, you will see the following table in the database:
Create UI Page
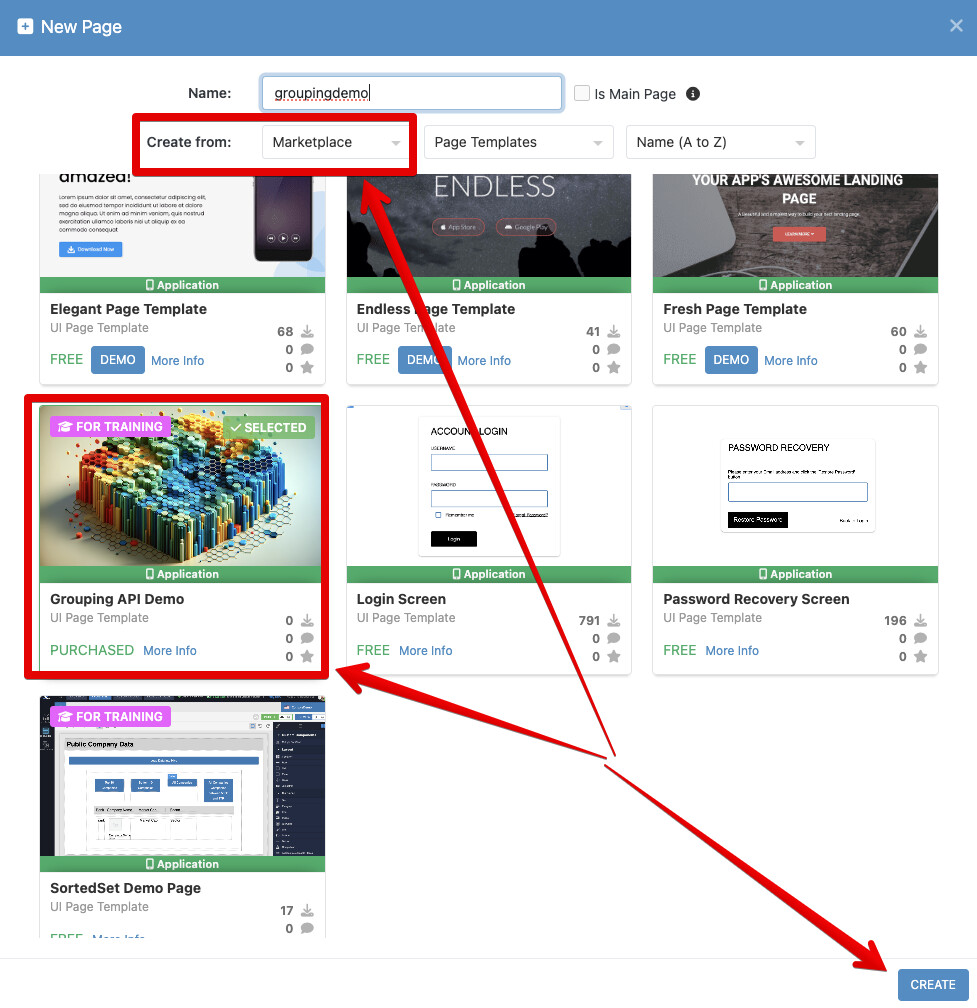
The UI page with all the logic and functionality demonstrating the Grouping API is available in the Backendless Marketplace. Navigate to the UI Builder section of the Backendless Console and open the popup to create a new UI page. Select Marketplace in the Create from dropdown and select the Grouping API Demo page template as shown below. Enter a name for the page and click CREATE:
Run the Page
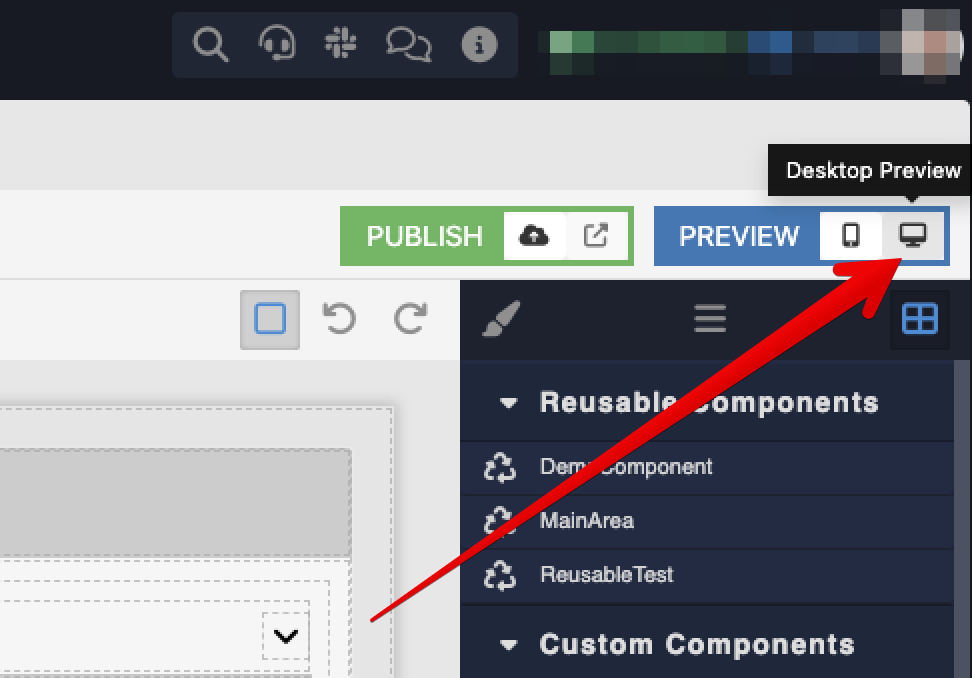
Click the Desktop Preview icon to run the page in the preview mode. You will be able to experience the functionality precisely as shown in the screen recording above:
Implementation Review
Let’s review how the page works. Return to the UI Builder interface, select the page itself and navigate to its logic by clicking the puzzle icon:
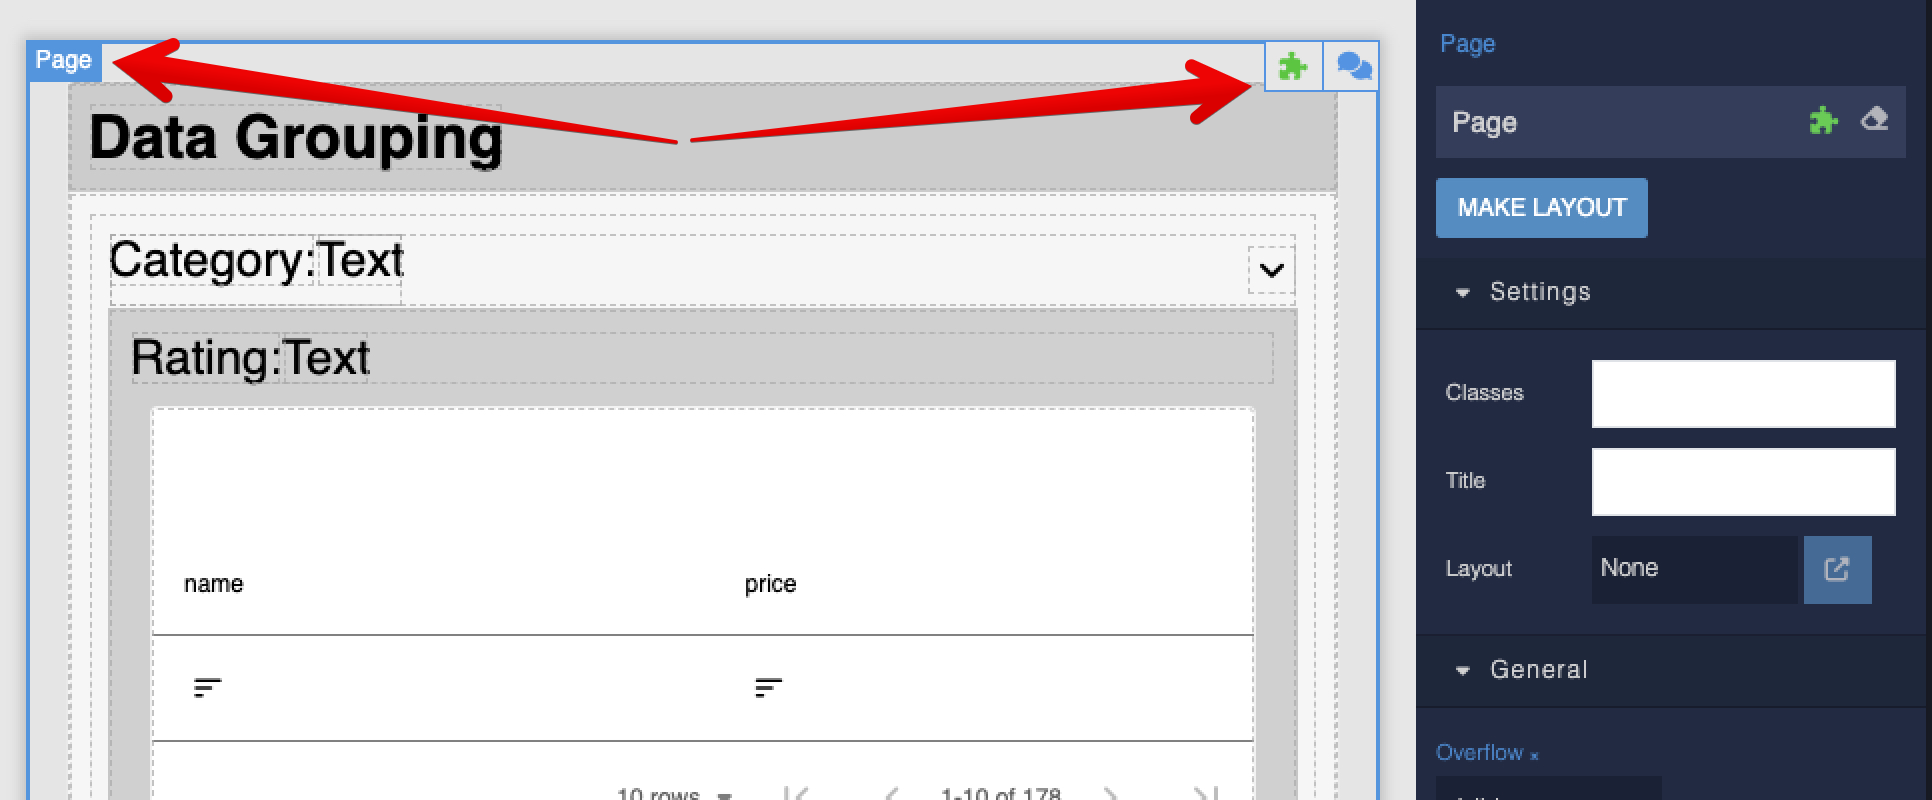
The
On Page Enter event shows the following Codeless logic: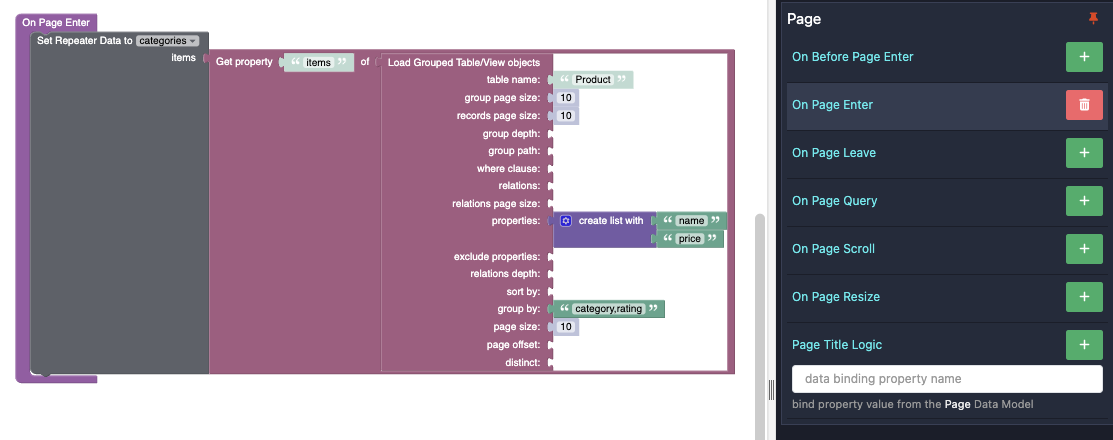
The logic uses the
Load Grouped Table/View objects block, which is the core of the Grouping API. The block returns a collection of records grouped by the category and then the rating columns. The logic extracts a value for the items property, which is a collection of objects representing the category groups. Each group has a property with the category name and a collection of the rating objects corresponding to the category. The items collection is assigned as the data model for the categories repeater. This starts the rendering process.
Return to the USER INTERFACE tab and select the ratings block:
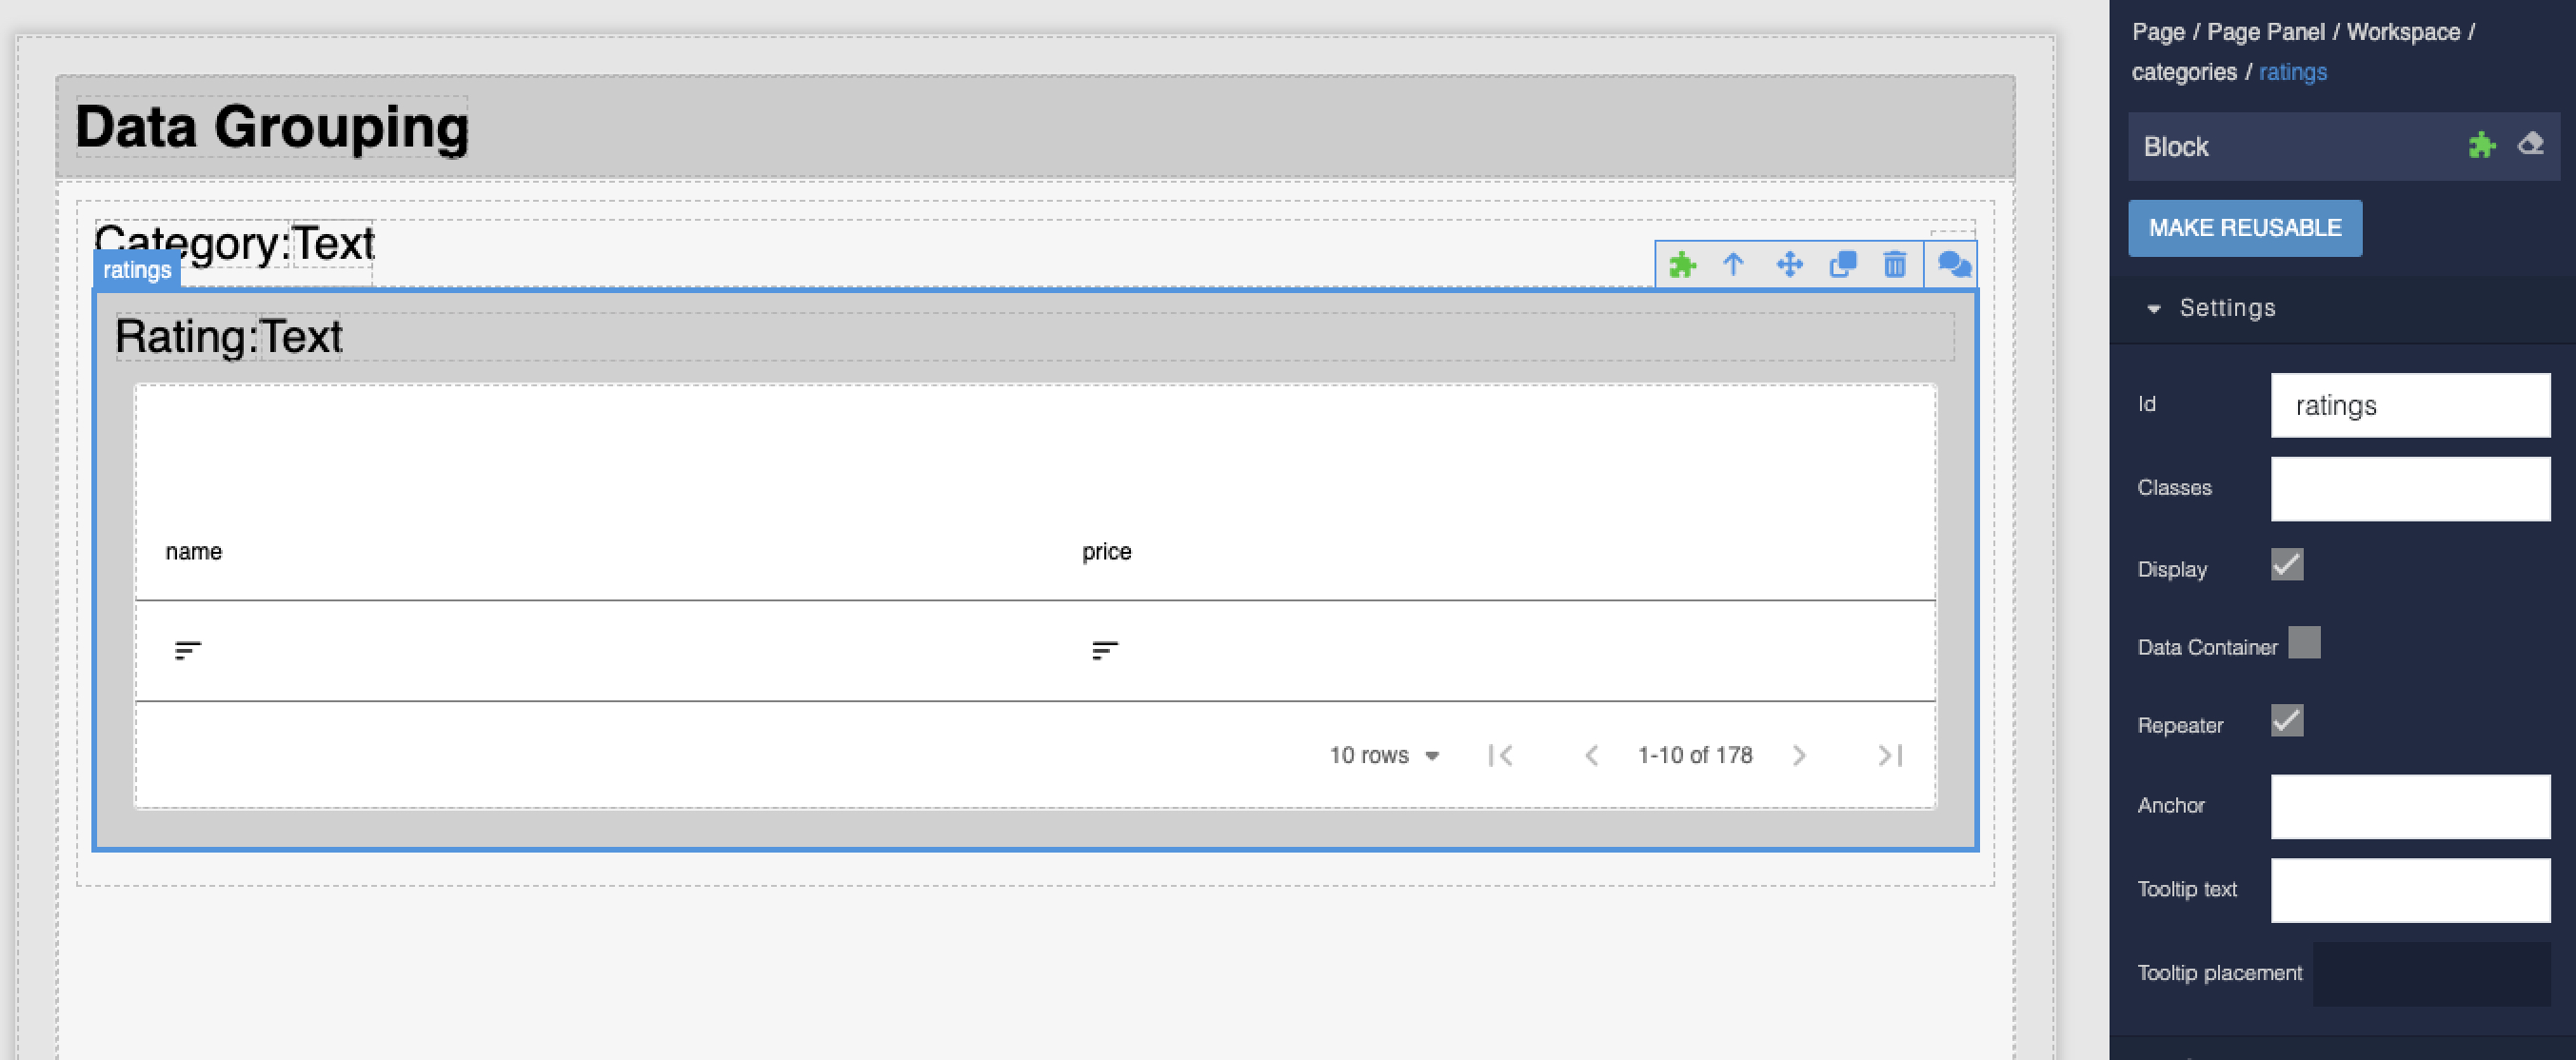
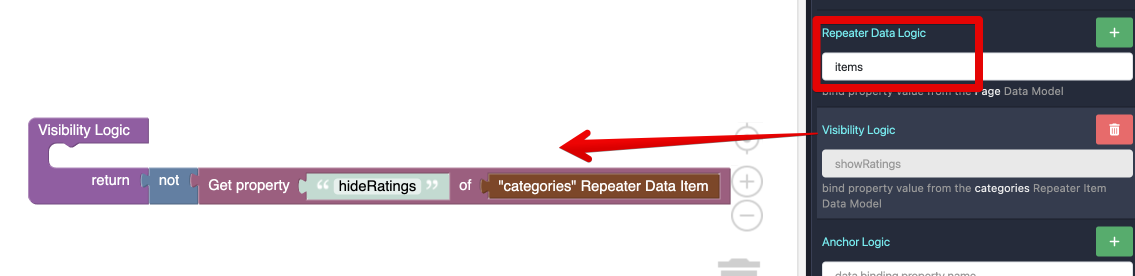
Navigate to the Logic section for the ratings block. You will see there are two logic elements:
- Data binding for the
Repeater Data Logic. It binds the repeater data to theitemsproperty. This is what drives the rendering of the ratings. Visibility Logic- controls the visibility of the ratings section depending on whether the section is collapsed or expanded:
Finally, return to the USER INTERFACE tab and click the Data Table component to select it. Click the puzzle icon to navigate to the component’s Logic section.
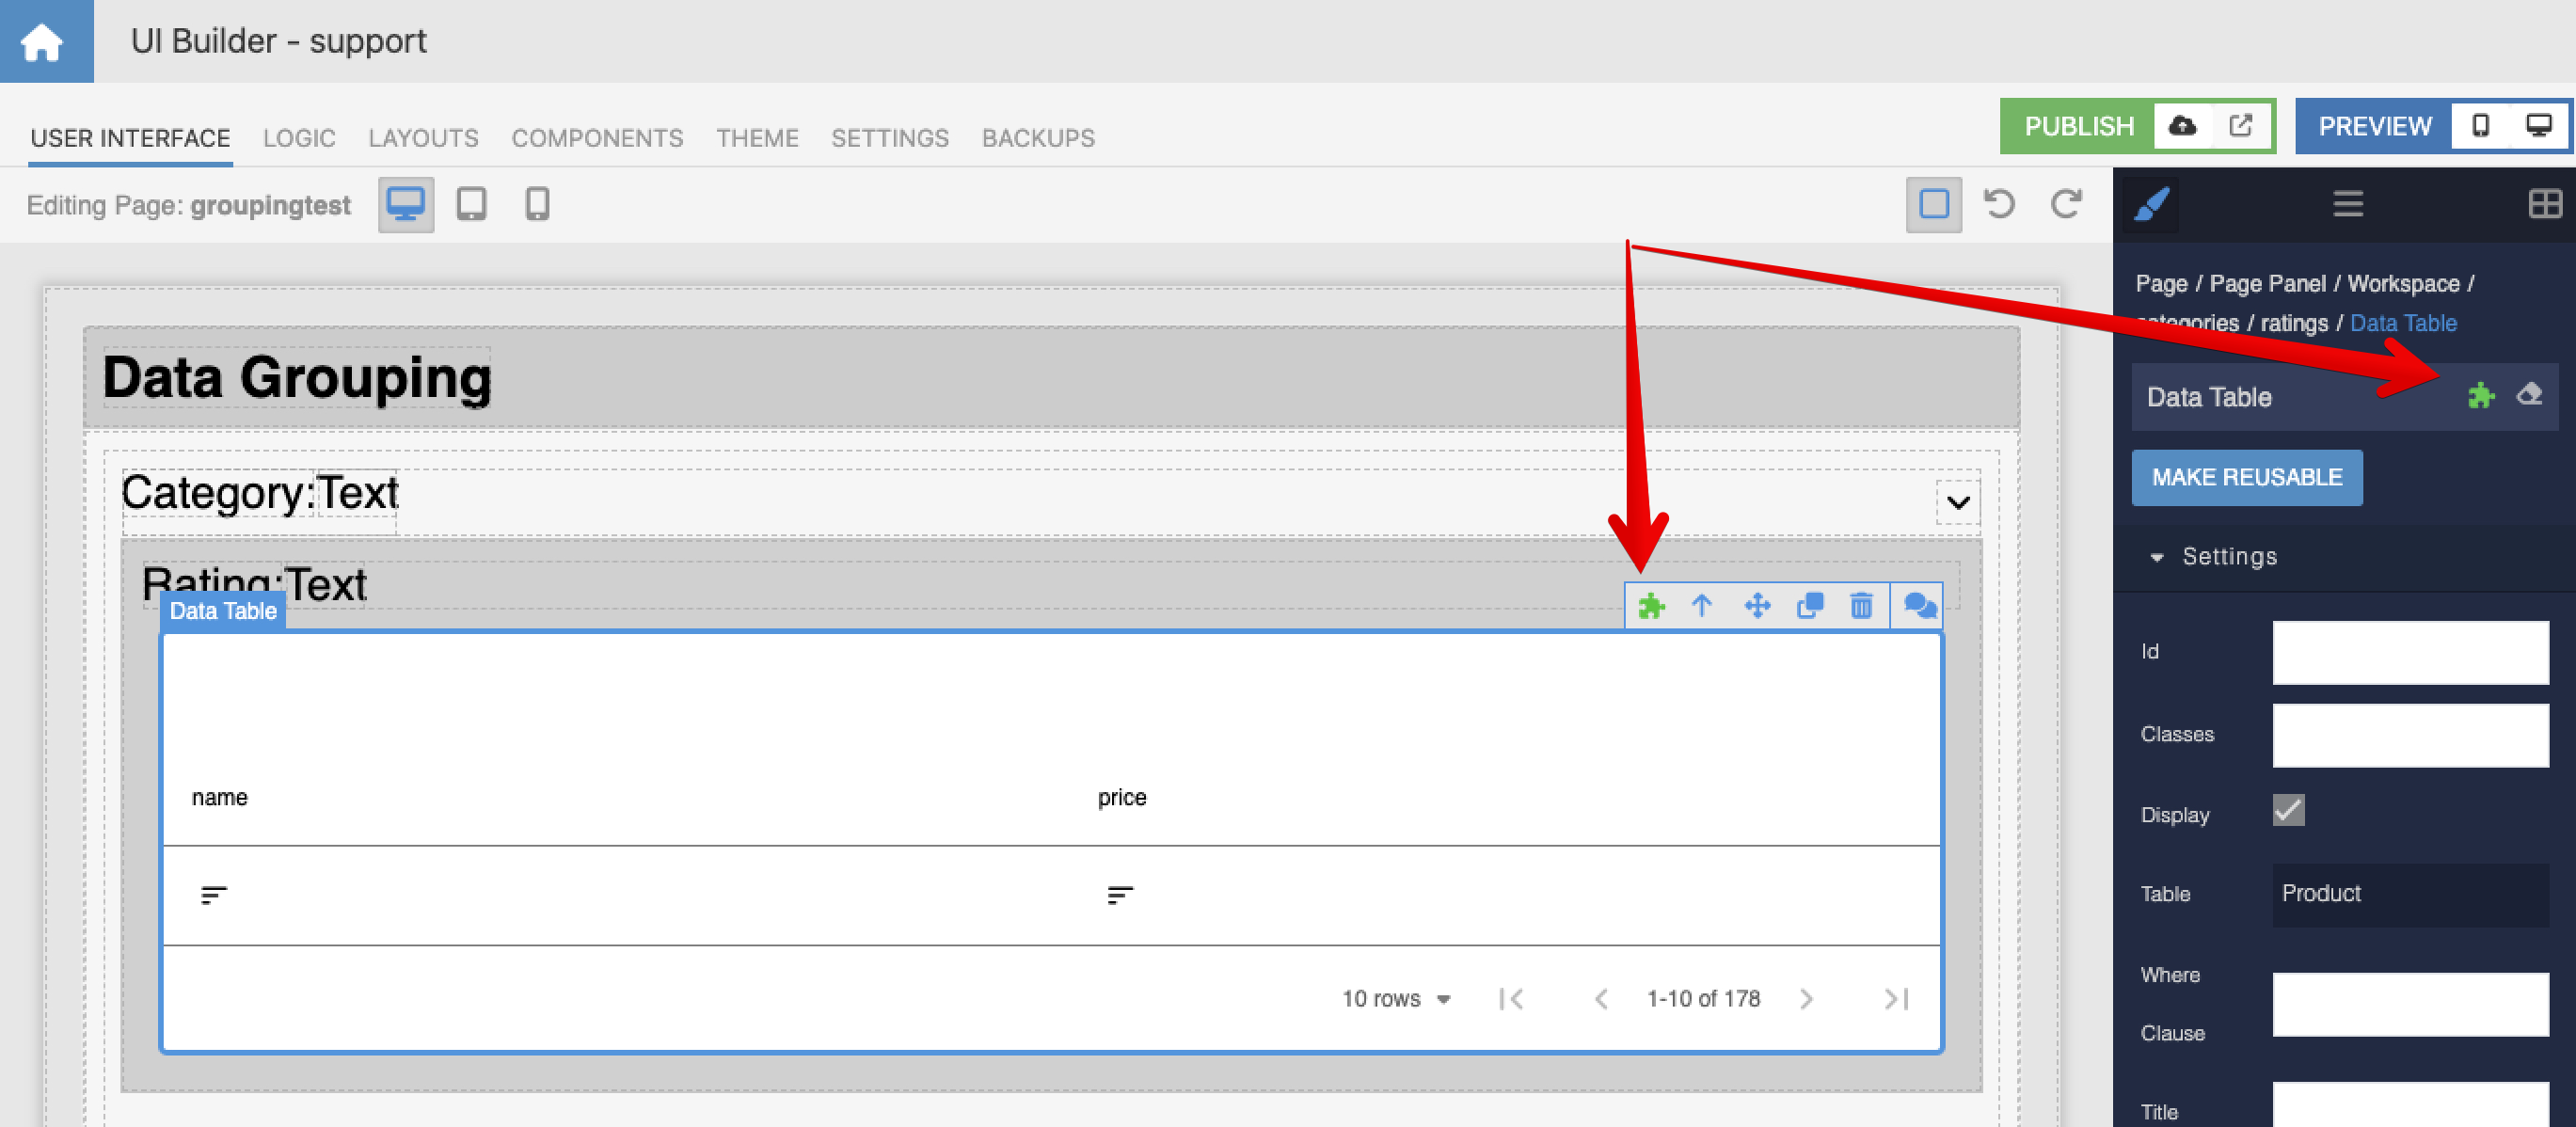
You will see the following logic:
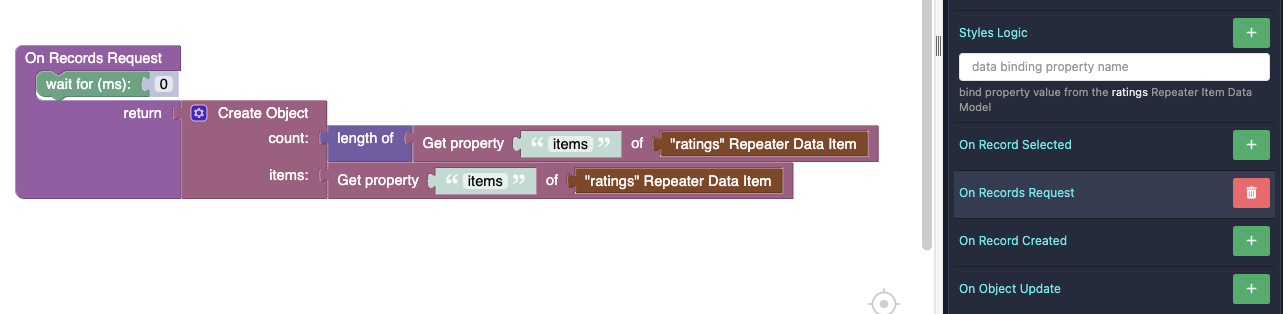
The logic returns the data objects for the current ratings group.
And that’s a wrap, that’s all the logic it takes to create a rendering of grouped data (I didn’t review the logic for collapsing/expanding individual groups - you are welcome to review it on your own by navigating to the Logic section for the icon component).
Please ask any questions, we’ll be happy to help.