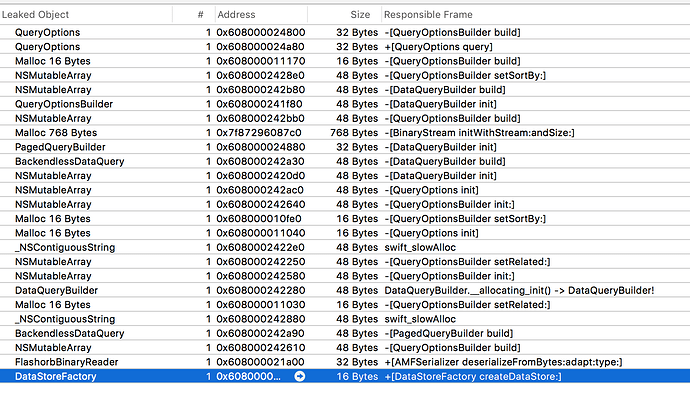
On the first view of my iOS app, I noticed the active running memory was idling quite high (200MB+) for a very simple screen, so I decided to profile with instruments to look for leaks.
Instruments seems to report that there are a bunch of leak-y backendless objects?
http://support.backendless.com/public/attachments/2525aa4fb2ce7fc2f9dcdb2f36e5aa51.png</img>
I also see more of the same in other places throughout the app that also build / run queries. This is with the 4.0 SDK.
Renato
