Hi, this is our app id: 41197742-122E-43BC-BE21-3BBDF13AD713
We just changed yesterday our plan to have a 50 api calls per minute, today we’ve been having problems with it, keeps giving us errors regarding reaching the 50 api calls limit when all we’re doing is just testing the app and logging in. Even when we stopped doing anythign for a minute and try to login error message keeps happening.
The app is still in testing and developmental stage so it should not be reaching that limit.
I can confirm that your Max Tier Threshold is currently set to Tier 4, which has a limit of 50 requests per minute.
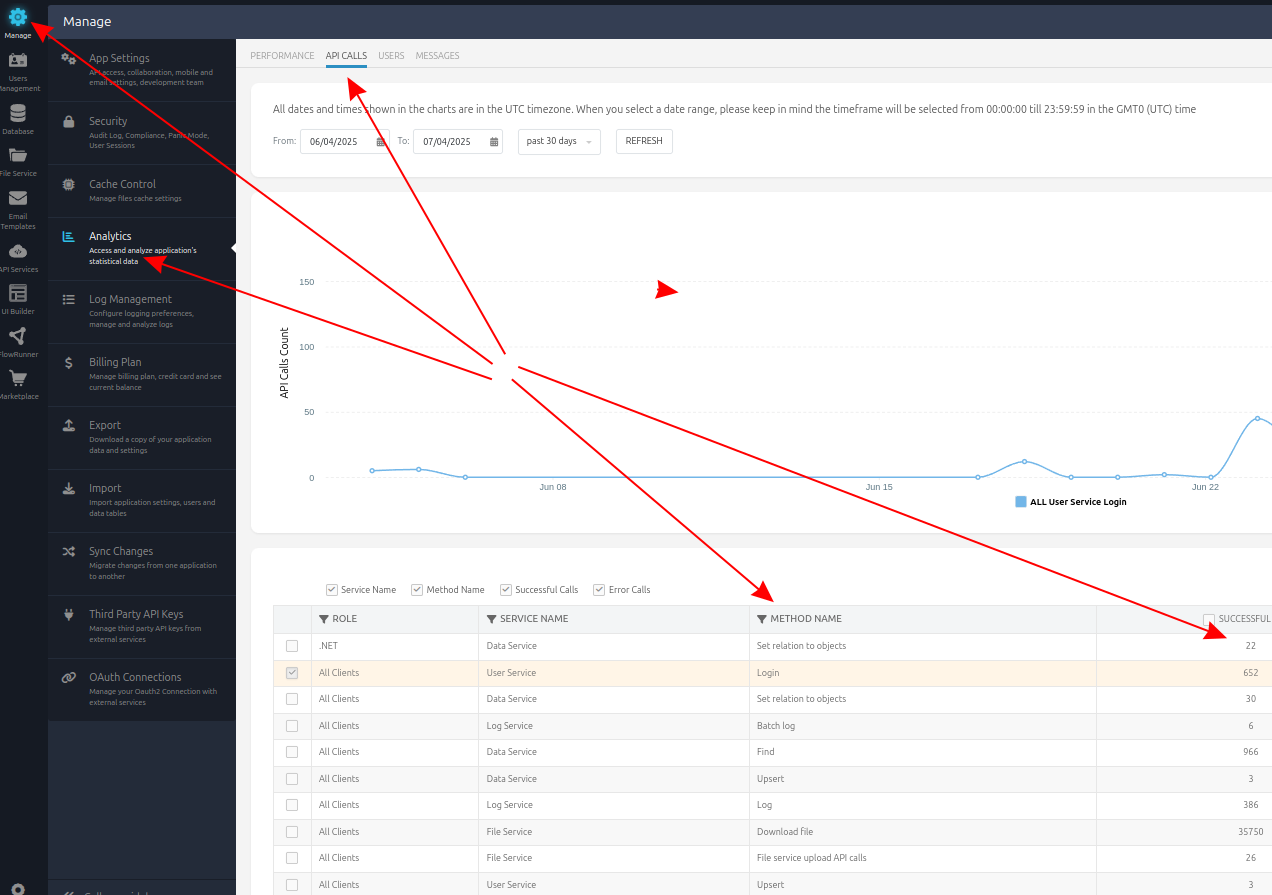
You can check detailed analytics on your API calls by going to Manage → Analytics → API Calls in the console.
I can see that the highest number of calls come from the Data Service (specifically, the Create operation), which suggests that your application is actively creating records in the database.
Regarding the Local Storage message, please take a look at this topic: Local Storage is Full
I recommend continuing to review the analytics to better understand what exactly is generating the traffic.
From what I can see, the traffic has dropped significantly in the past few hours, so it looks like you may have already taken some steps to address the issue.
Yes, we’ve been looking at it also, I’m asking why is the app doing so much api calls during the mobile bootup of the app on login when it has only 1 logo that’s being loaded to it and not as much during desktop loading of the same page.
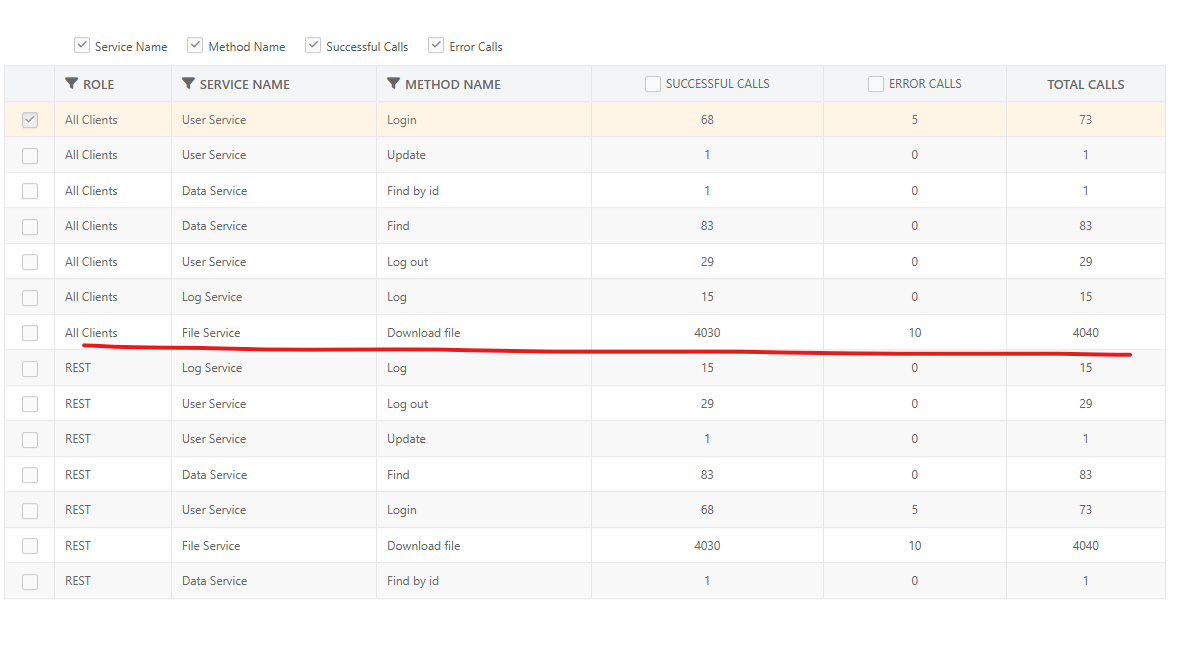
I cant figure out why it’s calling that much download file api calls, when it’s just loading 1 logo on the page everytime it’s run.
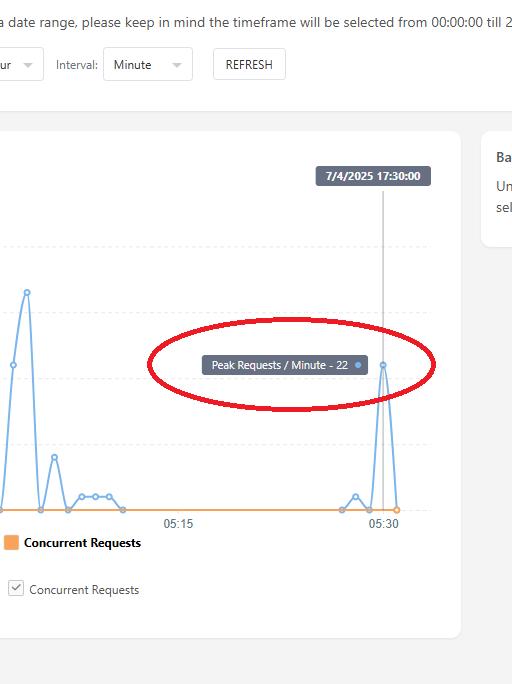
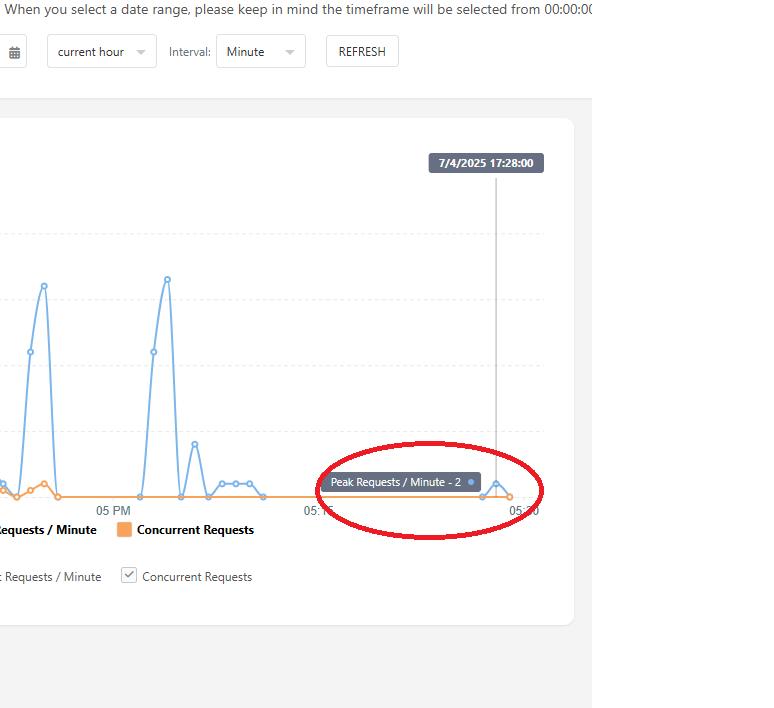
This page just gives me a breakdown of api calls during that time, and im just asking why does it do that much calls for a simple page during mobile testing that just does 1 api call which is to get the logo file only.
I might need some clarifications as there’s a possiblity im not reading the datas correctly.
To understand why there are so many API calls during the mobile version’s loading, the first step is to identify what exactly is being called, what resources are being requested, and what is triggering those calls.
Here are a few suggestions on how you can check this:
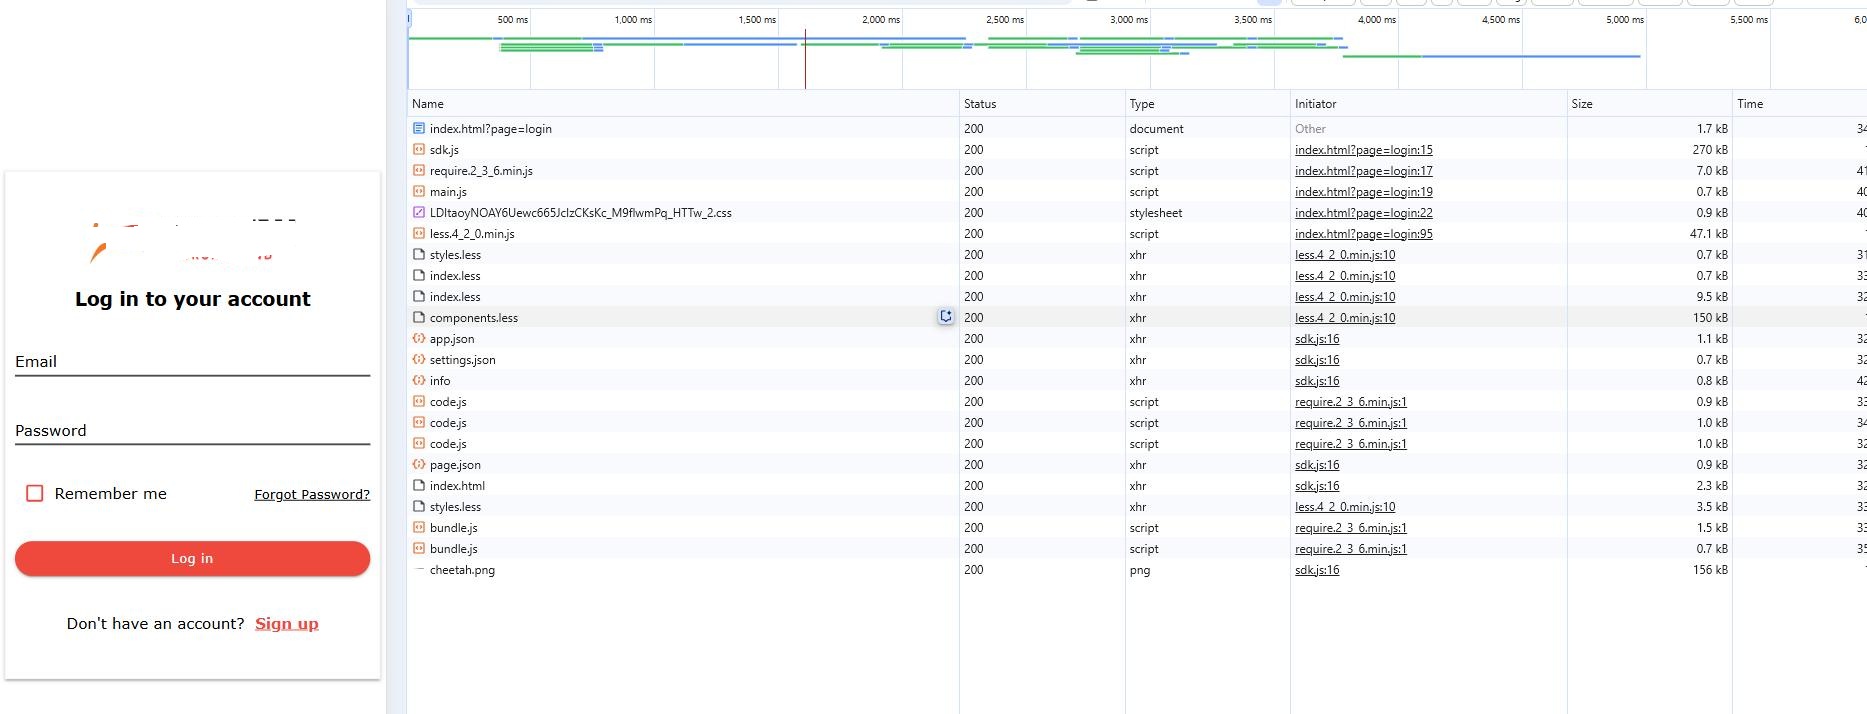
Use the “Network” tab in your browser’s DevTools (e.g., in Chrome):
Open the app in your browser (you can simulate mobile view using Ctrl + Shift + M).
Go to the Network tab.
Refresh the page (F5) and observe the list of requests.
Check if there are duplicate calls or unexpected requests to other files.
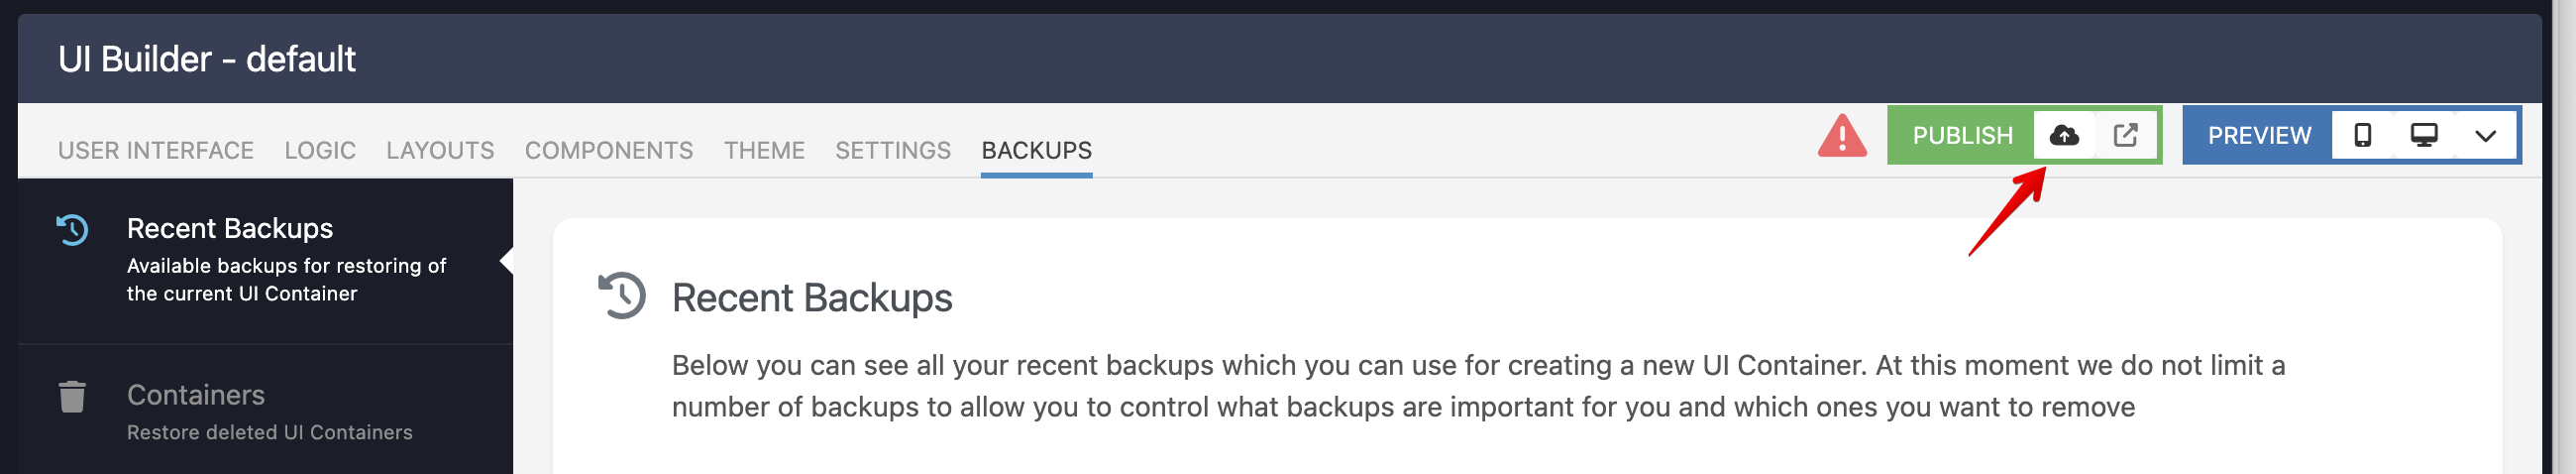
Inspect your component logic:
Sometimes, UI components (even hidden ones) may contain links to images or files that get loaded automatically.
Also, make sure there isn’t any dynamic resource loading depending on the device type (mobile vs. desktop).
Compare network activity between mobile and desktop modes:
This can help you identify whether different scripts, styles, or assets are being loaded on mobile.
If possible, please share a screenshot or log from the Network tab showing the calls made during app startup. That would help us better understand what might be happening and assist you more accurately.
Hello, you’re correct, we didn’t know that buttons, styles etc components used in the UI were also counted in the api calls. Is there a way to still use the UI builder without calling/downloading these? like so we can lower the api calls to a more acceptable levels for us?