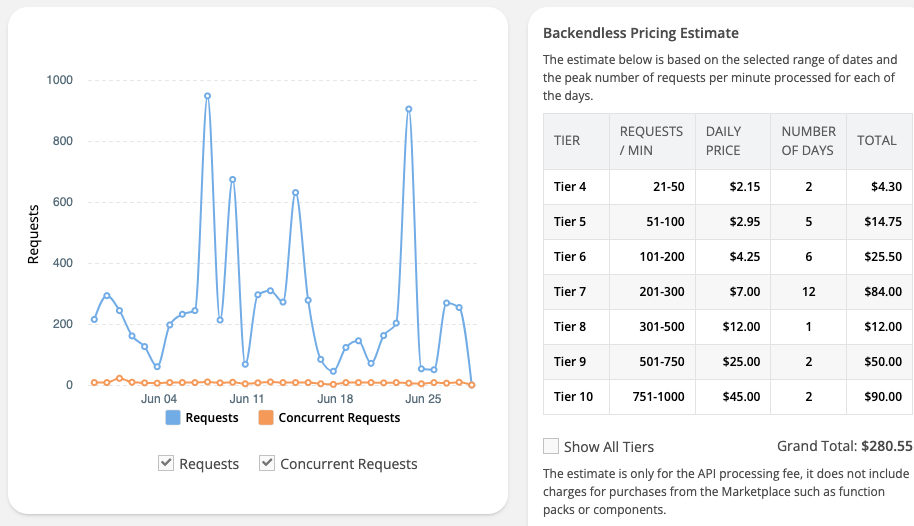
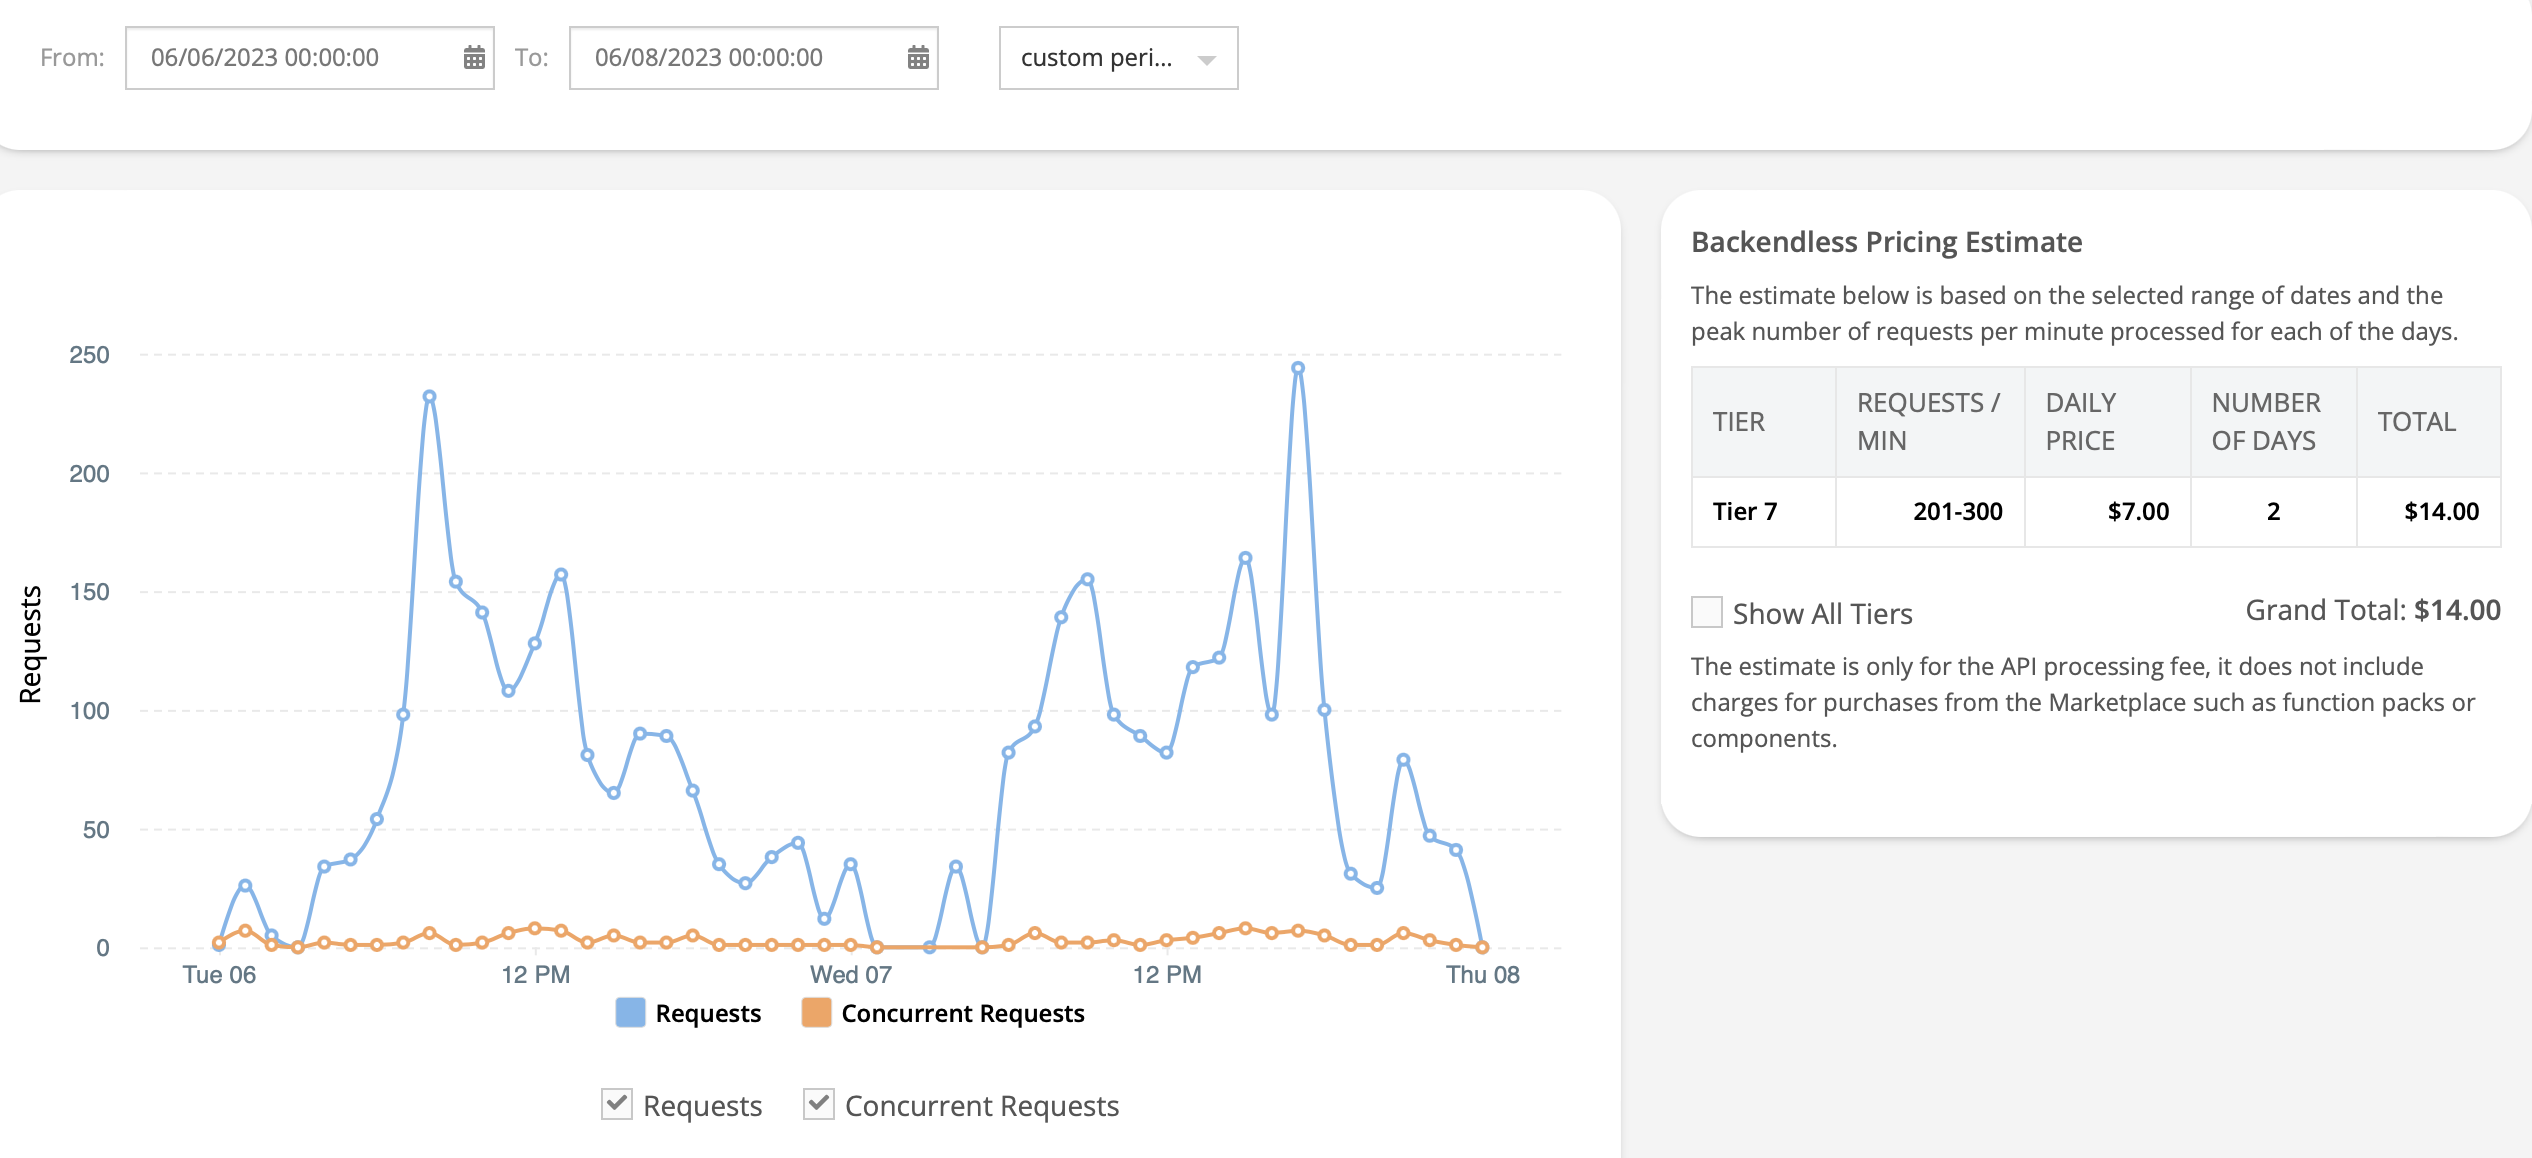
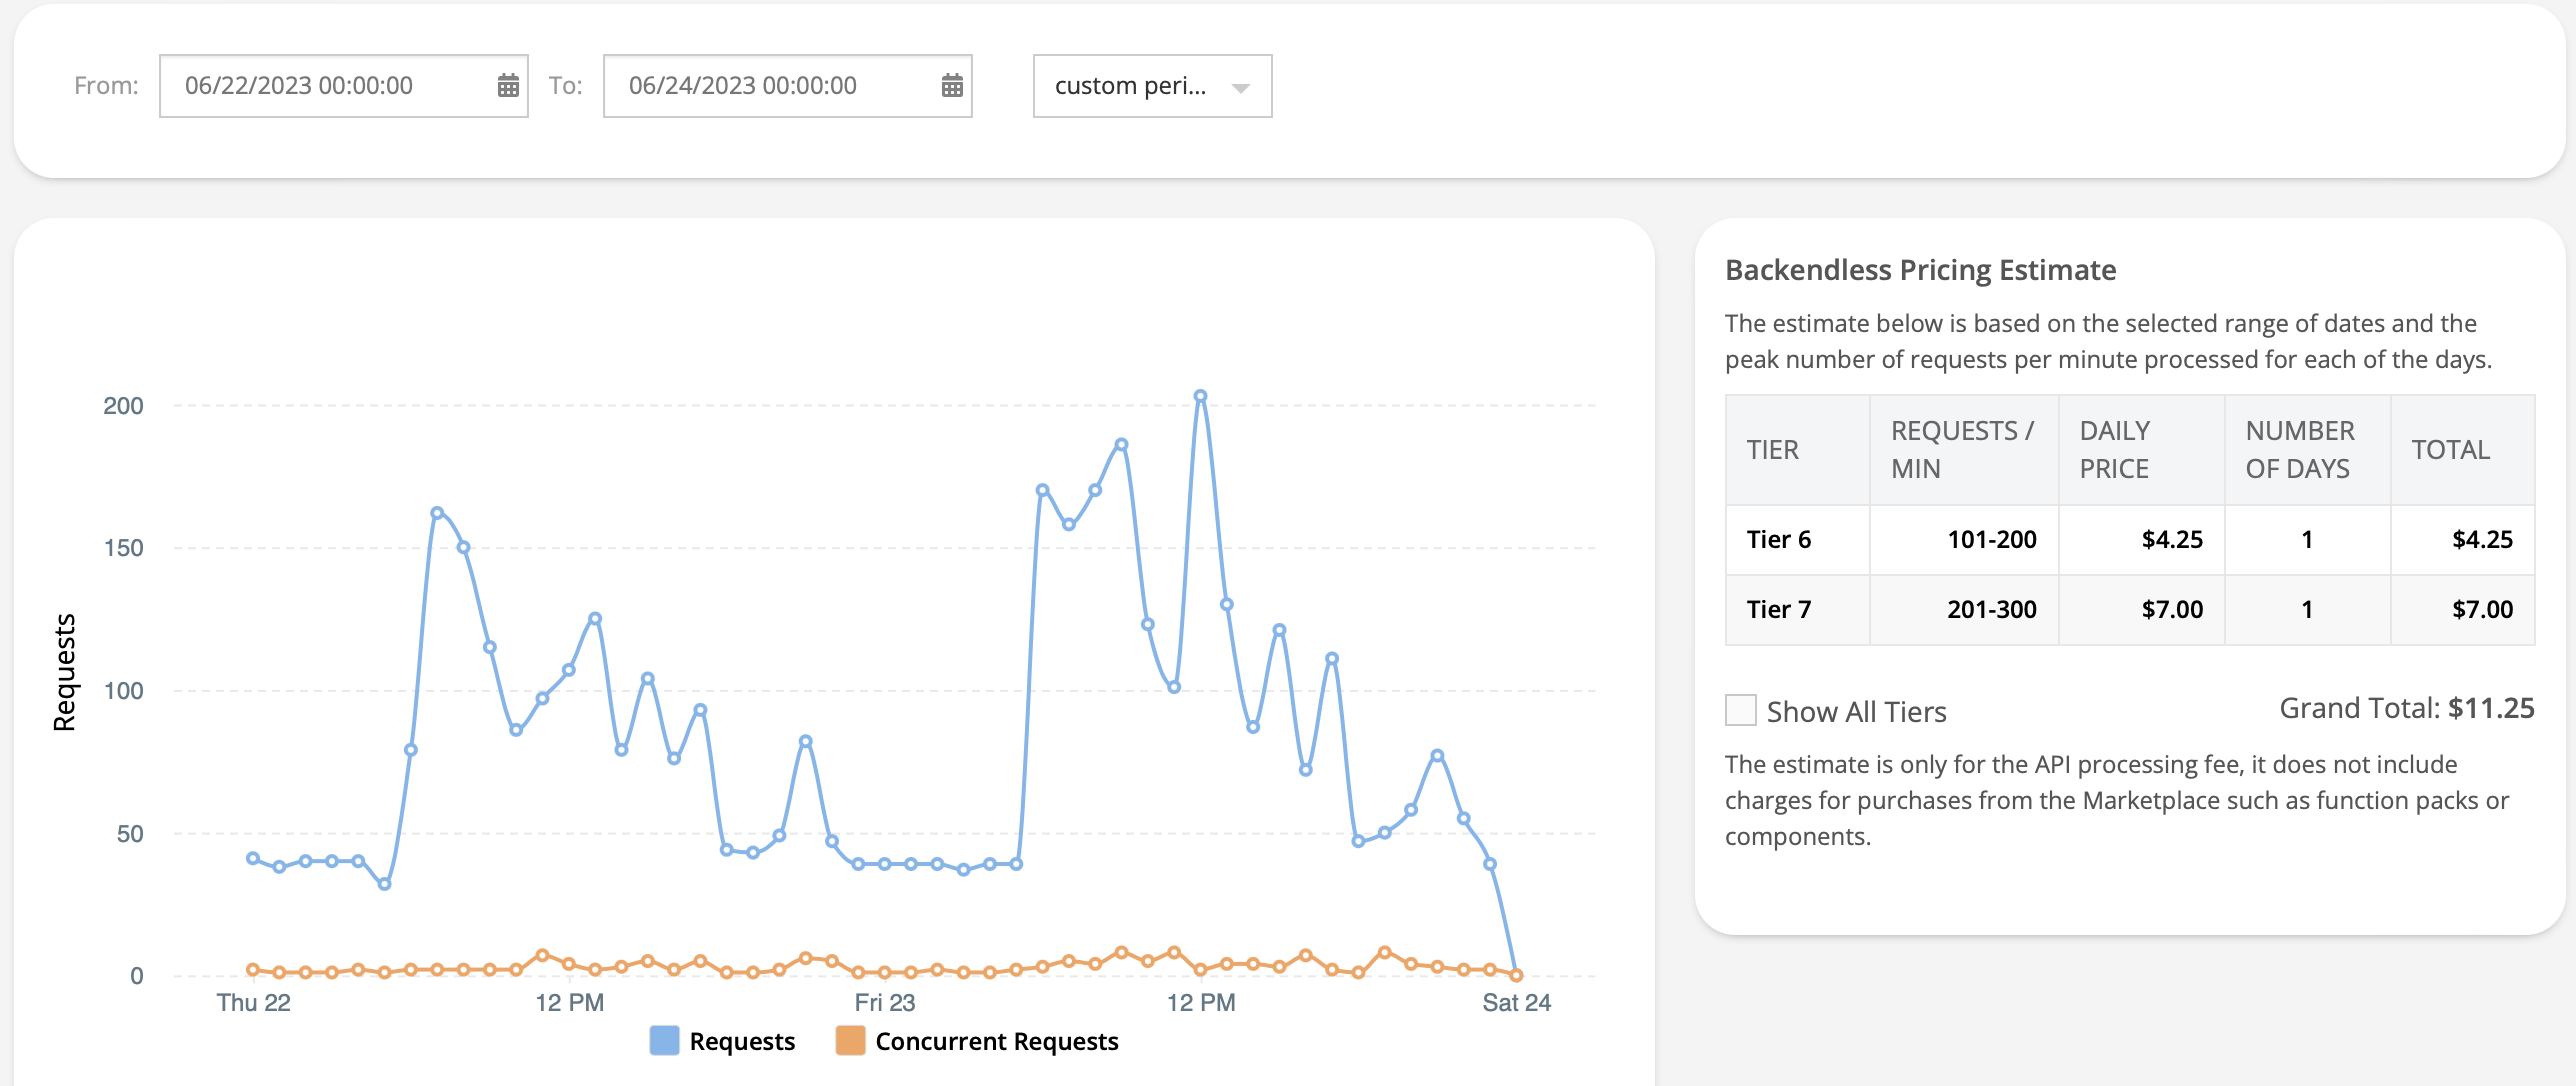
The conclusion is the were no Tier 10 those days just Tier 6 and Tier 7 looking in time frames of the full day.
Sorry but how to understand the Scale Plan if we can find when or where are the correct Tier? My business is a simple database of people visiting a location (Access Control) and going to Tier 10 it’s not possible to paid by the client (US$1350) and take me out of the business.
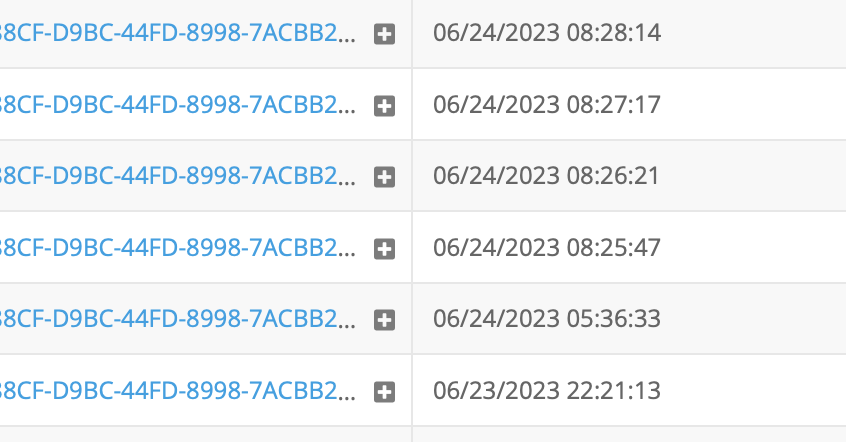
I found the second Tier 10 looking day by day on 06/24 at 08AM but when I like to check with the Visit registered activity was not the problem because was a weekend.
Do I understand correctly that some user has generated those 4 records in DB and that hit Tier 10, and you would like to know what happened to your user? I don’t know your app logic and can’t say what led that user to create 4 records (I don’t even know what these records mean). It is better to ask them what happened.
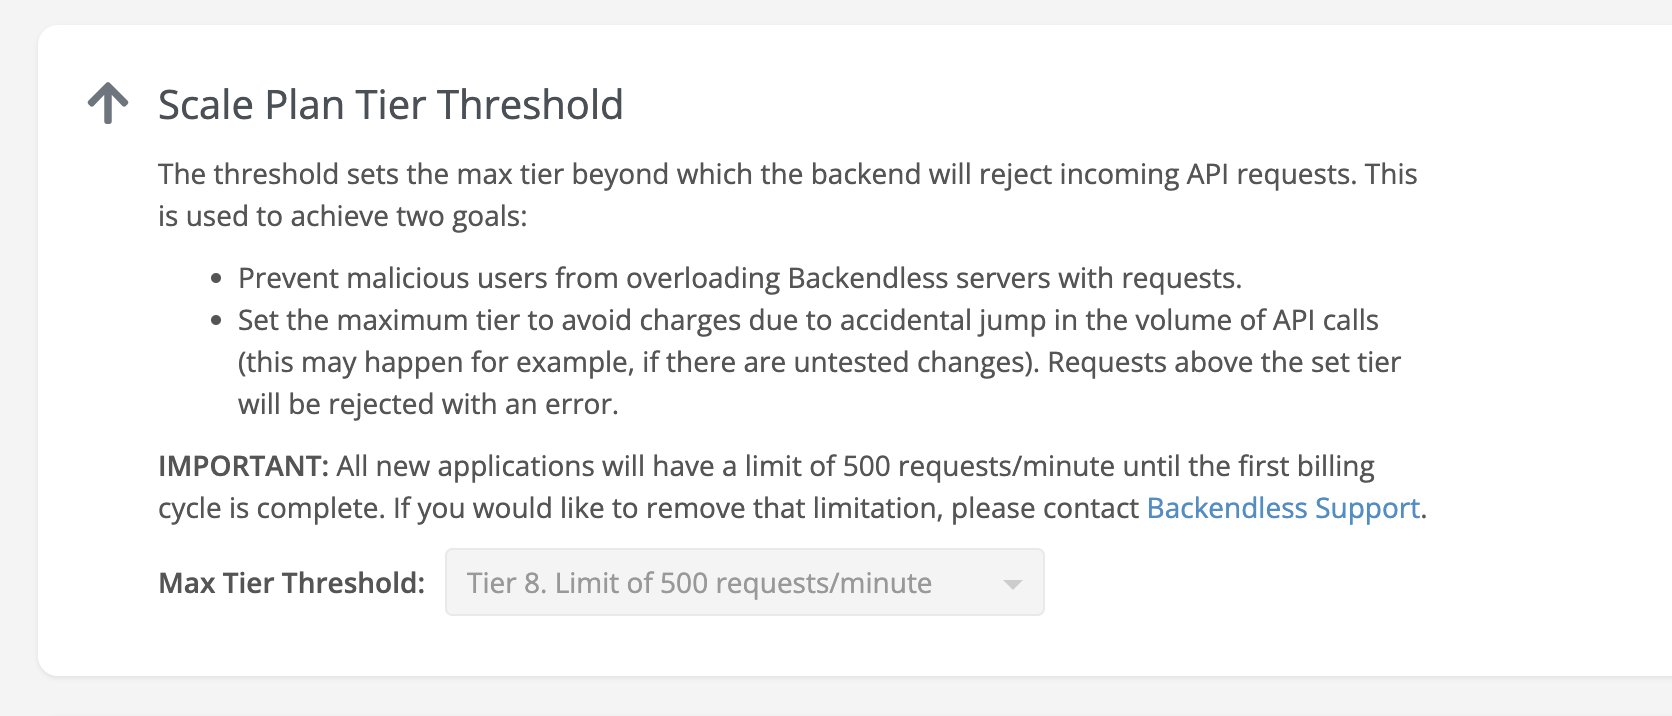
I would like to mention that apps on the Scale plan are able to set the max threshold beyond which the backend will reject incoming API requests:
OK, I mesuare the API Calls necessary for each operation and the quantity of operations necessary for standard operations. With that information I can fix the Threshold.
Hello. I’m also looking for some optimization advice. I have a simple app which gives users a 20-question quiz.
I was testing my app yesterday evening and reliably get about 80 requests on the performance tab under analytics for each test taken, with a peak of about 20 per minute.
On the performance tab I got a spike of 700 requests when I wasn’t testing my app. I only have a handful of external users and confirmed none of them were using the app during that time.
It appears there were 5500 REST data service FIND requests during the spike.
If it wasn’t me or my users, what could be the cause of the spike?
This mystery spikes are also part of my nightmares because in my case during weekend my access control system it’s almost none visitors and I had spikes Tier 10 and should be Tier 4.
I think in the Scale Plan it’s necessary to check the spikes to understand the services involved.
I have created an internal ticket - BKNDLSS-33066 - concerning dramatic spikes in Analytics. We will discuss with the team how we can improve this process to point out the services causing the spikes. Thank you for sharing your experiences and thoughts with us. We appreciate it.
I will describe below the process of analysis one can apply to understand where the calls and subsequent spikes can originate from. The key element for determining what contributes to a larger-than-expected number of API calls is having a controlled environment. That is an environment where you can clearly correlate users’ actions to the data you see in Backendless API analytics.
For a live application where users log in and perform various app functions, you will see aggregated data showing how many calls of different types were performed by all users over a period of time. Unfortunately, in that type of setup, extracting what the individual calls are and which APIs each individual user has contributed to the total numbers would be a very hard task. As a result, the hunt for spikes and areas to optimize will not be productive. The primary reason is that you do not know what users did, what pages they visited, and what navigation flows they executed. The environment is not controlled.
The simplest approach for creating a controlled environment is to clone your live Backendless app. This way you get an exact replica that is isolated from the users. When you use the cloned app, you know exactly what pages you navigated through and what operational workflows you executed. As a result, when you look at the analytics, you will see the API numbers that will be generated from a single user’s actions. At that point, the analysis becomes a repetitive flow consisting of:
Performing a single-user function (i.e. going through the registration page or navigating to the main app screen or performing a specific function in the app, etc)
Checking on the API CALLS screen to see what API calls were recorded by the system.
Determining if the numbers are greater than anticipated and if so, checking the actual logic that corresponds to the actions performed in step 1.
Making fixes in the logic and then re-running this process right from step 1 until the numbers look good.
Keep in mind that whatever the numbers you see are for a single user. When you have multiple users (in your live app), the numbers would need to be multiplied by the number of active users.
When you are done with the fixes and optimizations, they should be deployed back to the live app. The changes in UI can be deployed by creating an archive (zip) of the UI container and copying it to the live app’s Files storage. If the changes were done in the codeless API services, they can be deployed to the live app using the Sync Changes feature in Backendless Console.
I hope this is helpful and gives you an idea of how to proceed with further optimizations of your apps.
Thanks again. I found in general your instructions were super helpful.
For other newbies, I took my app offline so I was the only one using it, logged on to my app, then used the “inspect elements” tool on my browser (I was using Google Chrome- just right click on the page and go to “inspect” at the bottom of the drop-down). Then I just used my app in any and every way I could and monitored the requests to Backendless on the “manage- analytics” tab (looking at the time frame “current hour”).
Eventually I found that I had a 600ish per minute spike in requests at a certain stage in my app (that took a while to find!). Then I used the “inspect element-network” screen on my browser - it showed a specific API call was occurring every 100 milliseconds. It turned out that there was a data variable in my app refreshing every 100 milliseconds by making that API call. I changed the logic in my app so the data variable wouldn’t constantly refresh and the spike disappeared!