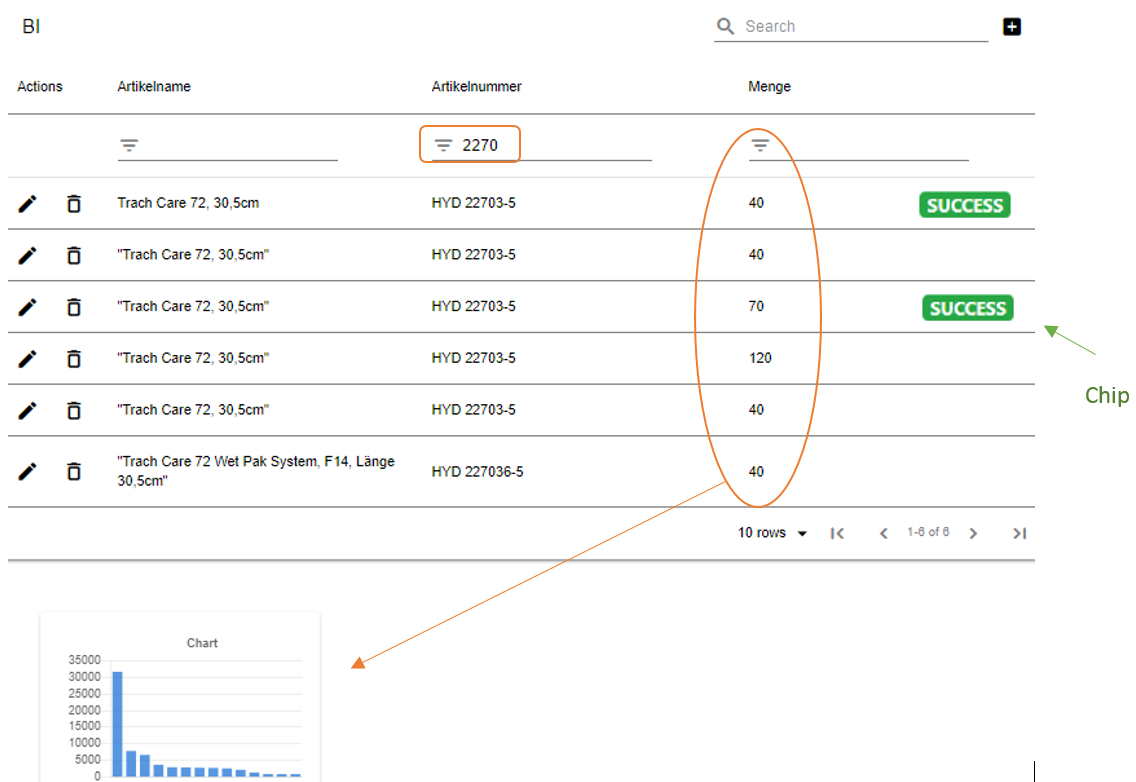
I often work with data tables. I am not clear what is possible with the data table component in UI Builder. How do I achieve advanced formatting in the tables? For example, different colours in the columns (depending on the values), displaying data as chips, displaying sparklines in the tables, displaying a picture or an avatar in the data table.
Also I do not know how to immediately update a chart when filtering the corresponding table. How do I link these components?
Thank you very much for your help and best regards
Eddie
Unfortunately, our Table Component hasn’t so much flexibility to render data as you want.
However, that could be implemented with Custom Components and external libraries. We’re preparing one of these now - React Data Grid: Cell Rendering
But the first release of this component in any case has no this functionality, and I can’t say any estimates when we will make the features that you ask for.
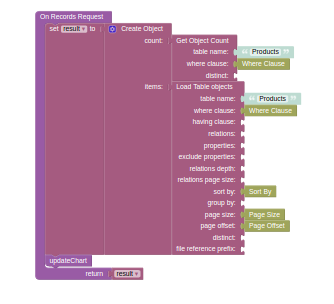
Also I do not know how to immediately update a chart when filtering the corresponding table. How do I link these components?
You could make it using “On Record Request” handler, below I provided an example of logic
This component was built on the Vue framework. At the same time we provide an instrument to build React components because all your apps it’s React underhood. That means it’s not compatible in general.